| Prev | Next |
Mind Mapping Diagram
Getting to know the Mind Mapping Diagram
Aspect |
Description |
|---|---|
|
Introducing the Mind Mapping Diagram |
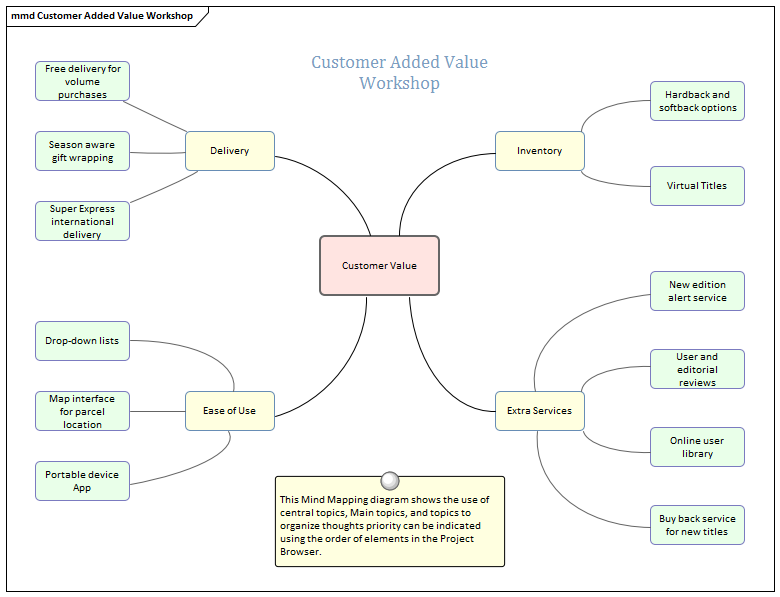
The Mind Mapping Diagram is a useful tool for recording ideas, thoughts and information in a simple and understandable format. The diagram is a type of spider (or radial) diagram where a Central Topic or idea is typically located at the centre of the diagram and Main Topic, Topic and Sub-Topics radiate out as the ideas are explored and recorded.
An analyst will often be required to take notes or record ideas (including their own) and information in the context of meetings, workshops and focus groups. The Mind Mapping diagram is a useful tool and its simple and appealing layout makes it accessible to everyone. Regardless of what formal languages or frameworks are being used to articulate requirements and processes and other artifacts the Mind Mapping diagram requires little or no explanation.
|
|
Where to find the Mind Mapping Diagram |
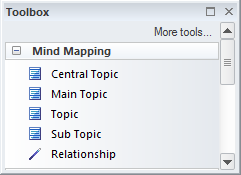
Ribbon: Design > Diagram > Insert > Mind Mapping > MindMapping Diagram Project Browser Toolbar : New Diagram icon > Mind Mapping > MindMapping Diagram Project Browser context menu | Add Diagram... > Mind Mapping > MindMapping Diagram |
|
Usage of the Mind Mapping Diagram |
A MindMapping Diagram can be used to record ideas and information in the context of a workshop, focus group, meeting or even to get your own thoughts down. It becomes a compelling visual record of the communication and discussions and often acts as a precursor to more formal techniques such as requirements articulation, Architecture modeling database design and more. Requirements and other elements such as Capabilities, Acceptance Criteria, design Components, User Stories and more can all be traced back to Topics and Sub-Topics in a MindMapping Diagram. |
|
Options for the Mind Mapping Diagram |
A MindMapping diagram can be made more expressive with the use of images and colors. The appearance of the Central Topic and Main topics could use an image that visually communicates the central idea. Colors can be applied to communicate concepts such as the importance or the owner of an idea or any other concept. Dependency relationships can be added to show how ideas relate to each other; for example, which stakeholders have specific interactions or which services depend on other services. The MindMapping Diagram (like any diagram) can be viewed as an element list which makes working with the element's properties easier.
Diagram Filters can also be used when presenting the diagrams, to draw attention to parts of the diagrams. The diagrams can be presented as hand drawn or in a whiteboard style by changing the properties of the diagram. |
|
Learn more about the Mind Mapping Diagram |