| Prev | Next |
Data Modeling Diagram
Getting to know the Data Modeling Diagram
Aspect |
Description |
|---|---|
|
Introducing the Data Modeling Diagram |
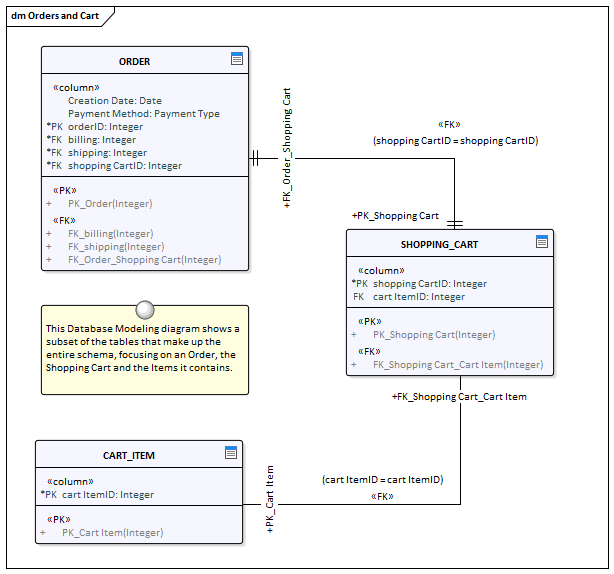
The Data Modeling diagram is used to create or view graphical models of relational database system schemas including a range of database objects. The diagrams can be drawn at a logical or a physical level. When a physical schema is being represented the modeler can choose the correct RDBMS which will enable the appropriate data types. Tables, Views, Stored Procedures and other objects are connected showing the way they are related to each other. Tables are the central element of the schema and can show the contained columns including datatypes, indexes and keys.
|
|
Where to find the Data Modeling Diagram |
Ribbon: Design > Diagram > Insert > Extended > Data Modeling Project Browser Toolbar : New Diagram icon > Extended > Data Modeling Project Browser context menu | Add Diagram... > Extended > Data Modeling
|
|
Usage of the Data Modeling Diagram |
The Data Modeling diagram can be used to create database schemas or to view schemas that have been reverse engineered from a live database connection or transformed from a more primitive model. It is a useful diagram to visualize the connections between a variety of database objects. They can also be used to show traces back to other elements such as Requirements, logical Components, and Business Rules. |
|
Options for the Data Modeling Diagram |
A schema can be created from scratch, generated by a Model Transformation or reverse engineered from an existing database through an ODBC connection. The schema can contain a range of database objects, including:
Primary, Foreign and Unique keys can also be modeled and displayed on the diagram. There are also several different notations that can be used, including:
The notations can be interchanged by changing the 'Connector Notation' property. Diagram Filters can also be used when presenting the diagrams to draw attention to parts of the diagrams, and the diagrams can be presented as hand drawn or in a whiteboard style by changing the properties of the diagram. |
|
Learn more about the Data Modeling Diagram |