| Prev | Next |
Flow Chart Diagram
Getting to know the Flow Chart Diagram
Aspect |
Description |
|---|---|
|
Introducing the Flow Chart Diagram |
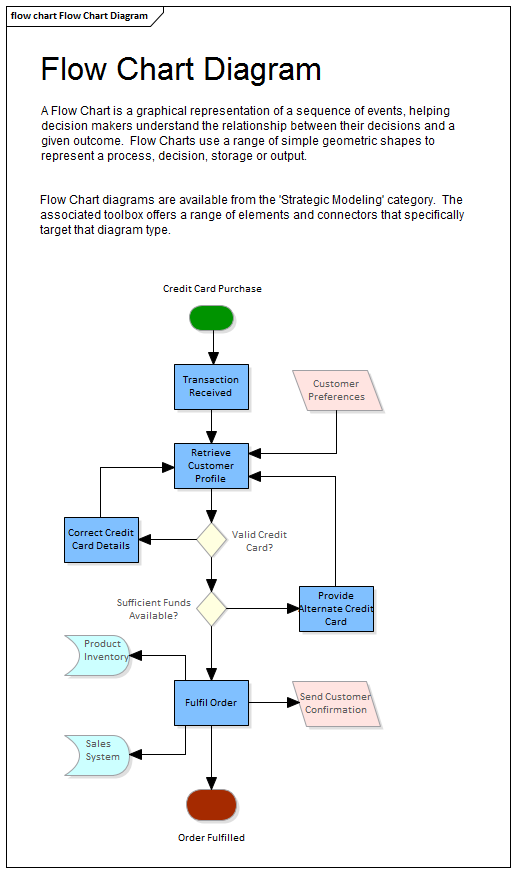
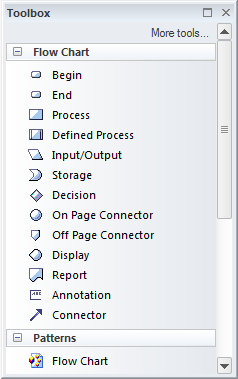
The Flow Chart Diagram is a strategic diagram that allows the steps in a process, workflow or algorithm to be ordered in a sequence and displayed graphically. The steps are modeled as rectangles and choices are modeled as diamonds, there are inputs and outputs and data stores available for modeling the things that are consumed, produced and stored by the process.
|
|
Where to find the Flow Chart Diagram |
Ribbon: Design > Diagram > Insert > Strategic Modeling > Flow Chart Project Browser Toolbar : New Diagram icon > Strategic Modeling > Flow Chart Project Browser context menu | Add Diagram... > Strategic Modeling > Flow Chart |
|
Usage of the Flow Chart Diagram |
The Flow Chart Diagram can be used for visualizing, analyzing and communicating about the steps and outcomes in workflows, processes and computer algorithms. |
|
Options for the Flow Chart Diagram |
Flow Chart Diagrams can have nested Activities allowing hierarchies to be defined. Responsible parties can be defined by the use of swim lanes.
The Flow Chart Diagram (like any diagram) can be viewed as an element list which makes working with the element's properties easier. Diagram Filters can also be used when presenting the diagrams to draw attention to parts of the diagrams and the diagrams can be presented as hand drawn or in a whiteboard style by changing the properties of the diagram. |
|
Learn more about the Flow Chart Diagram |