| Prev | Next |
Gantt View
Getting to know the Gantt View
Aspect |
Description |
|---|---|
|
Introducing the Gantt View |
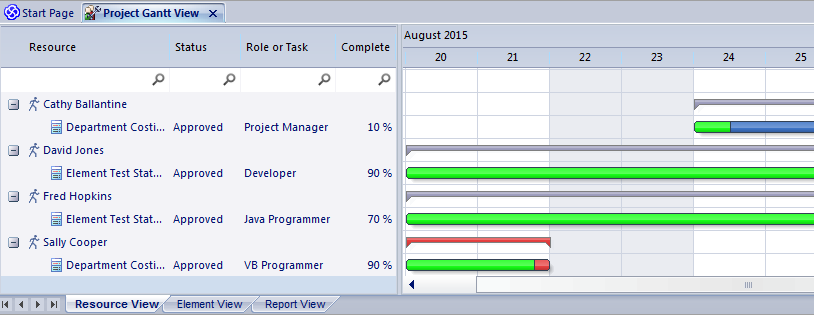
The Gantt View is a tool for visualizing the elements in a Project, Package or Diagram and the resources that have been allocated to them. There are a number of different Gantt charts available:
The tool will empower the traditional or agile project manager to ensure that a projects resources are allocated to repository content and help ensure high value outcomes are achieved right from within the repository.
|
|
Where to find the Gantt View |
Ribbon: Design > Package > Gantt Ribbon: Design > Diagram > View As > Gantt Diagram Context Menu: Open Diagram in | Gantt View Project Browser Context Menu (on an open diagram): Open Diagram in | Gantt View |
|
Usage of the Gantt View |
The Gantt View's primary use is to display the allocation of resources to elements in the repository and to mange the work breakdown structure. There are a wide range of views and filters that can be applied to tailor the view or to make it more relevant to a particular audience. Allocations can be made to any elements in the repository from high level Packages level down to an individual element such as a Class, Activity or Change. It is a powerful tool for a project managers wanting to visualize how a team is being utilized and ultimately to deliver high value and high priority outcomes. Modelers working on a project can view their own work and update their progress while working on assigned tasks. While broad changes can be made using the visual duration bars in the Gantt View it is common practice to use the tool in conjunction with the Resource Allocation window where fine details can be entered and adjusted. |
|
Options for the Gantt View |
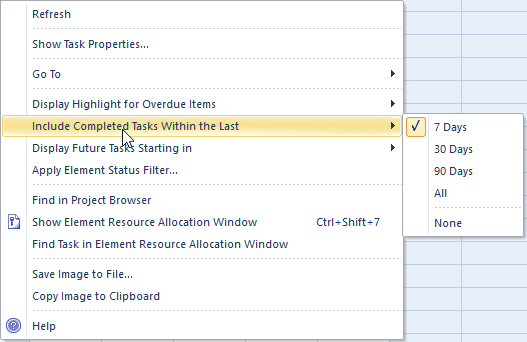
The Gantt View is a highly flexible tool that can be configured to display information in a number of different ways. Filters can be used to show only elements that have a particular status or more generally by using the Bar and finding elements that contain the specified filter text in a particular column. It is also possible to filter the display by Start or Completion date or to just show overdue tasks. Broad changes can be made to the duration of tasks by simply dragging the ends of the visual bars. The scale of time can be altered on the display to allow short and long term planning and to get condensed and expanded views. The Gantt chart can conveniently be copied to the clipboard and pasted in to other applications or saved into a file. There is a wide range of other options that are available, making the tool invaluable to a team and schedule-based approach to modeling.
|
|
Learn more about the Gantt View |


