| Prev | Next |
Data Flow Diagram
Getting to know the Data Flow Diagram
Aspect |
Description |
|---|---|
|
Introducing the Data Flow Diagram |
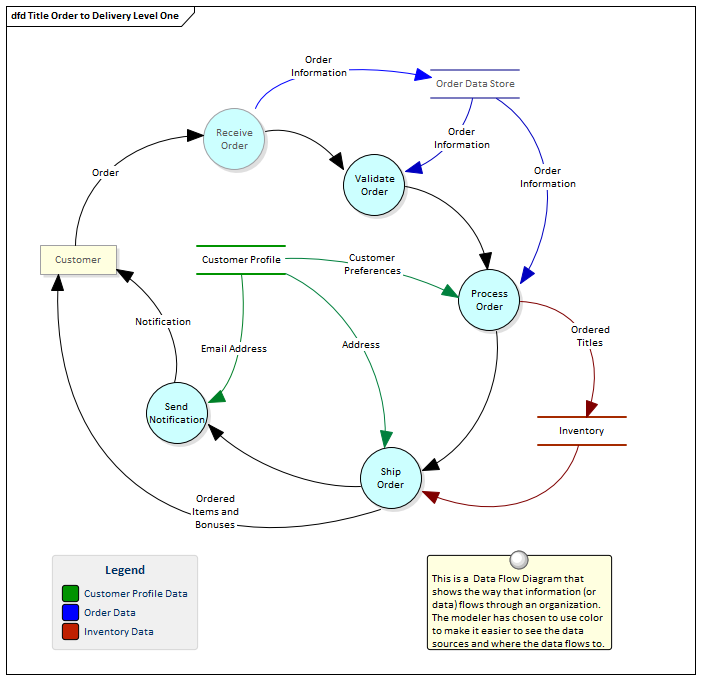
The Data Flow diagram (DFD) is part of the Structured Systems Analysis and Design Method and is used to show the way that data flows through a system including the Processes, Data Stores and Entities that relate to the data.
A hierarch of diagrams is typically created that start from the Context diagram, which is said to be at 'level 0' in the hierarchy. |
|
Where to find the Data Flow Diagram |
Ribbon: Design > Diagram > Insert > Data Flow Diagrams > Data Flow Diagram Project Browser Toolbar : New Diagram icon > Data Flow Diagrams > Data Flow Diagram Project Browser context menu | Add Diagram... > Data Flow Diagrams > Data Flow Diagram |
|
Usage of the Data Flow Diagram |
The Data Flow diagram can be used to create a data- and process-centric view of a system at any level. While the BPMN Business Process diagram is not centered on data the Data Flow diagram is data-centric and shows which Processes consume, produce and store data. The diagrams are useful for a data analyst who needs to know how data moves through a system, from the context level where data flows between external entities and through the system down to the lowest level. |
|
Options for the Data Flow Diagram |
The Data Flow diagram can be assembled into a hierarchy, and drill down to lower level diagrams can be achieved using the child diagram functionality. The Processes can be organized into a hierarchy using the Project Browser; the child diagrams can be nested under each Process node in the Project Browser tree.
Colors can be used to represent particular data and how it flows through the system. Target and Future State diagrams can be drawn and transitions can describe how processes can be improved and made more efficient. The Data Flow diagram (like any diagram) can be viewed as an element list, which makes working with the element's properties easier. Diagram Filters can also be used when presenting the diagrams, to draw attention to parts of the diagrams, and the diagrams can be presented as hand drawn or in a whiteboard style by changing the diagram properties. |
|
Learn more about the Data Flow Diagram |