| Prev | Next |
Setting Code Breakpoints
Normal Breakpoints are typically set on a line of source code. When the Debugger hits the indicated line during normal execution, the Debugger halts execution and displays the local variables, call stack, threads and other run-time information.
Set a breakpoint on a line of code
Step |
Action |
See also |
|---|---|---|
|
1 |
Open the source code to debug in the integrated source code editor. |
|
|
2 |
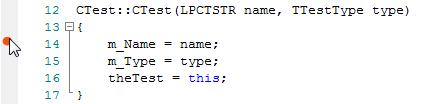
Find the appropriate code line and click in the left margin column - a solid red circle in the margin indicates that a breakpoint has been set at that position.
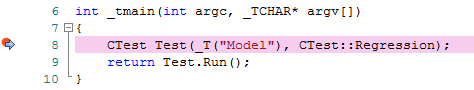
If the code is currently halted at a breakpoint, that point is indicated by a blue arrow next to the marker.
Alternatively, you can set the Breakpoint marker (or other marker) by right-clicking on the left margin on the required line, to display the breakpoint/marker context menu; select the appropriate marker type. |
Set Record Markers |