| Prev | Next |
Visual Execution Analysis

The Visual Execution Analyzer (VEA) is made up of an advanced and powerful suite of tools that allow you to build, debug, record, profile, simulate and otherwise construct and verify your software development while keeping the code tightly integrated with your model. Enterprise Architect has rich support for a wide range of popular compilers and platforms, in particular the Java, .Net and Microsoft Windows C++ environments. Software development becomes a highly streamlined visual experience, quite unlike working in traditional environments.
Enterprise Architect is itself modeled, built, compiled, debugged, tested, managed, profiled and otherwise constructed totally within the Visual Execution Analyzer built into Enterprise Architect. While the VEA can be used to complement other tool suites, it also shines when used as the primary development IDE in close coupling with the model and project management capabilities provided by Enterprise Architect.

|
Visual Execution Analysis
This collection of images shows the variety of controls at your disposal |
Access
|
Ribbon |
Code > Configure > Analyzer > Edit Analyzer Scripts Execute > Run > Analyzer |
|
Keyboard Shortcuts |
|
Execution Analyzer Features
Feature |
Description |
|---|---|
|
Build & Debug 
|
Using Analyzer Scripts linked to Model Packages, it is possible to tightly integrate the code/build/debug cycle into Enterprise Architect. For Java, .Net and Microsoft C++ in particular, it is simple to link to project code bases and take over the building and debugging within Enterprise Architect's Model Driven Development Environment. In addition to standard debugging features, the strong coupling with the model and the use of advanced debugging features such as Action Points makes Enterprise Architect the ideal platform from which to both design and construct your software application. |
|
Simulation 
|
Bring your behavioral models to life with instant, real-time behavioral model execution. Coupled with tools to manage triggers, events, guards, effects, breakpoints and simulation variables, plus the ability to visually track execution at run-time, the Simulator is a powerful means of 'watching the wheels turn' and verifying the correctness of your behavioral models. |
|
Profiling 
|
Lift the hood on software performance and see what is actually going on. Quickly gain a clear picture of why certain tasks behave poorly or worse than expected. Whether its Microsoft .NET, native C++ or Java, use profiles to effectively judge changes in performance over your software lifecycle. |
|
Recording Execution 
|
Record the execution of code without the need for instrumentation. Control the amount of detail through filters and stack depth. Generate beautiful Sequence diagrams and diagrams that illustrate Class collaboration. Use recording to create Test Domain diagrams that can be used with the VEA Testpoints feature. |
|
Testing 
|
Create and manage test scripts for model elements. Explore the Testing interface, supporting unit, integration, scenario, system, inspection and acceptance tests. Employ programming by contract methodology with the Testpoints facility. |
|
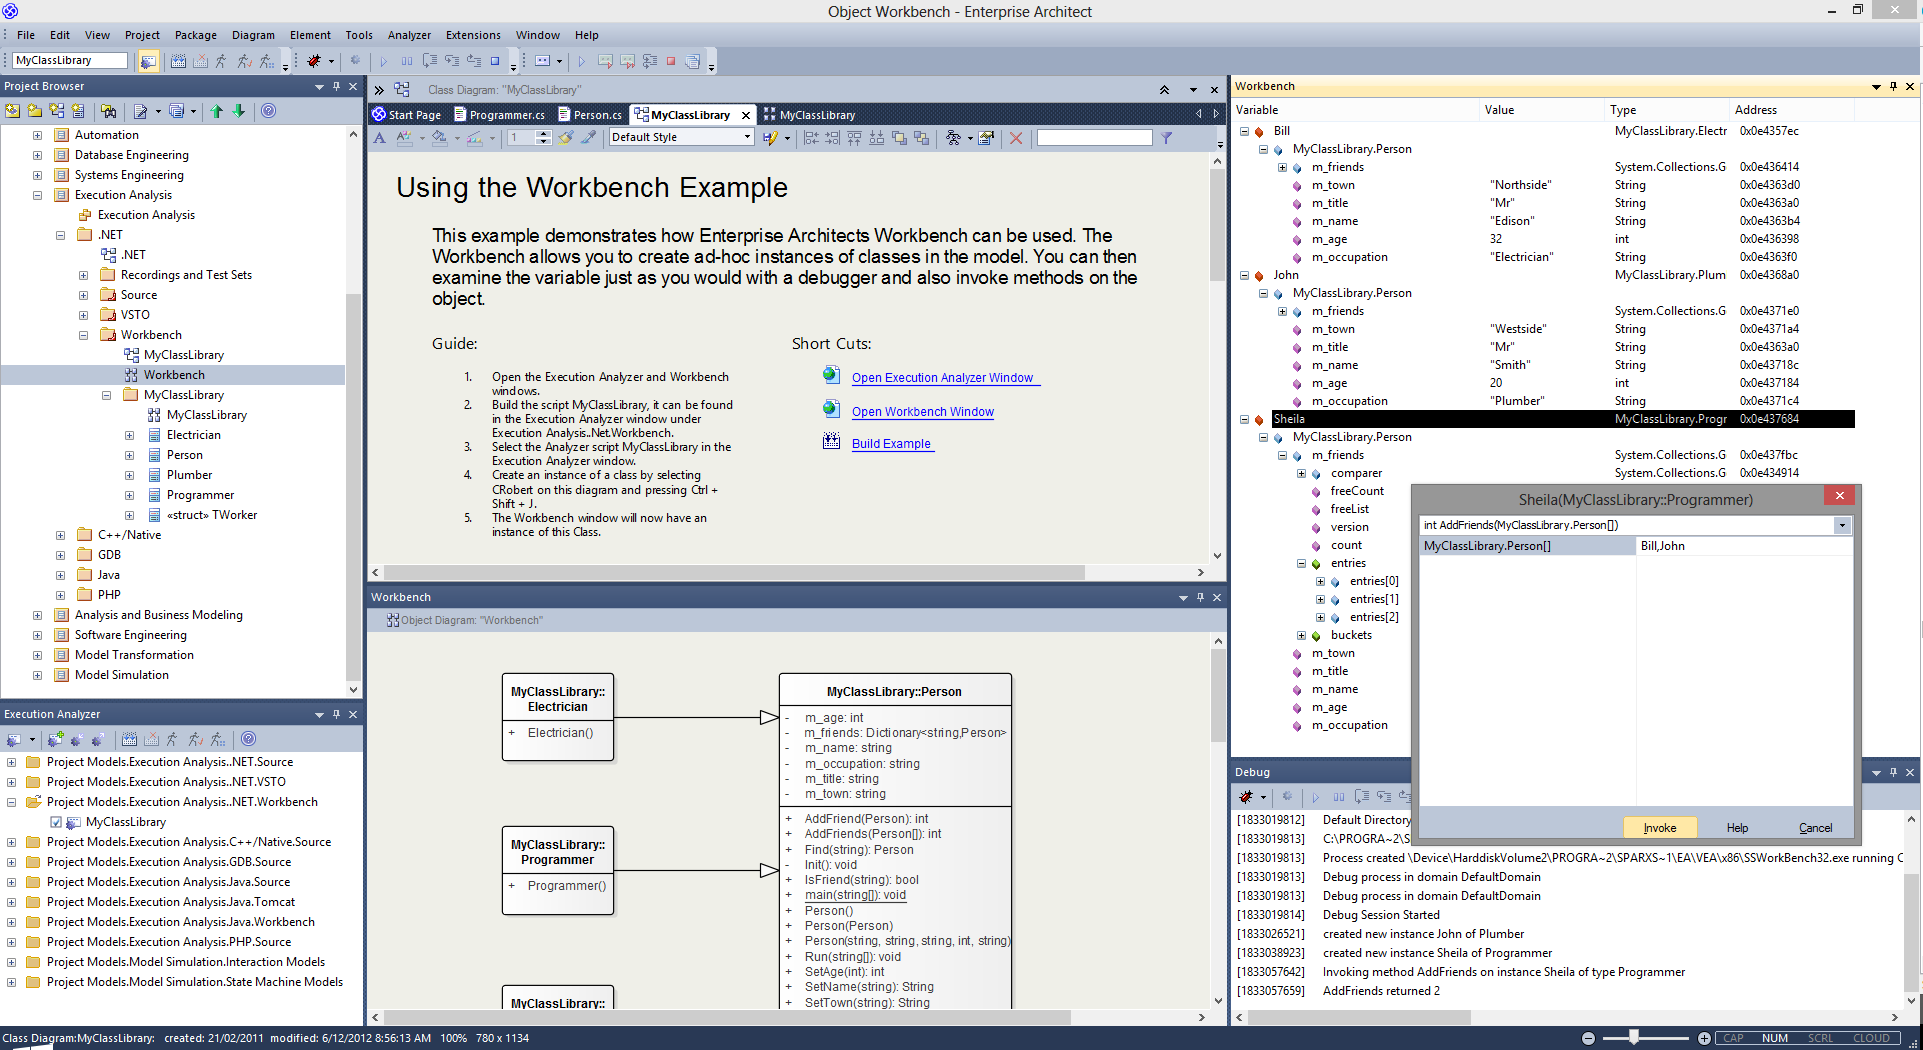
Object Workbench 
|
Workbench class behavior on the fly, by instantiating them in the Object Workbench and then invoking their operations. You can even pass objects on the workbench as parameters to other workbench objects. |
|
Visual Execution Analyzer Samples 
|
Try our sample patterns to set up and explore some of the powerful features of the Visual Execution Analyzer. |
Benefits of the Execution Analyzer
The Execution Analyzer provides an integrated development and testing environment for multiple platforms, including Microsoft .NET, Java, Native code and Android. It includes a feature-rich debugger, execution recording and profiling, and Testpoint management.
It helps you to generate Sequence, Test Domain Class and Collaborative Class diagrams from a single recording. This is a great way to understand and document your application.
- Optimize existing system resources and understand resource allocation
- Verify that the system is following the rules as designed
- Produce high quality documentation that more accurately reflects system behavior
- Understand how and why systems work
- Train new employees in the structure and function of a system
- Provide a comprehensive understanding of how existing code works
- Identify costly or unnecessary function calls
- Illustrate interactions, data structures and important relationships within a system
- Trace problems to a specific line of code, system interaction or event
- Visualize why a sequence of events is important
- Establish the sequence of events that occur immediately prior to system failure
- Simulate the execution of behavior models including StateMachines, Activities and Interactions
Operations
Operation |
Description |
|---|---|
|
Simulate UML behavior models to verify their logical and design correctness, for:
|
|
|
Record executing programs and represent the behavior as a UML Sequence diagram; recording is supported for:
|
|
|
Quickly view / report on behaviors of running applications. Profiling is supported for these platforms:
|
|
|
Testpoints Management provides a facility to define the constraints on a Class model as contracts. The contracts provide the assets on which to create Test domains. A single Testpoint domain can then be used to test and report the behavior of multiple applications. You can also use the Execution Analyzer to record a Use Case and generate a Test Domain diagram with very little effort. Any existing Testpoints are automatically linked to the generated domain or the Test Domain diagram can be used as the context for new contract compositions. How an application behaves for a given Test domain can be seen immediately in real time! Results are displayed in the Testpoint report window every time a contract is passed or failed. The decoupling of test measurement from the code-base has a number of benefits, one of which is aiding the reconciliation of multiple systems with a common Test domain, rather than one another. The Testpoint system supports these contracts:
|
|
|
Create and work with objects created within the Enterprise Architect modeling environment using a dynamic Object Workbench.
|
|
|
Run nUnit and jUnit tests for Java and Microsoft .NET Record and document results. |
|
|
Execution Recording and Profiling both acquire a collection of relevant code files, which you can reverse-engineer to the current model in a single operation. |
Learn more

