| Prev | Next |
Detecting Memory Address Operations
Being able to detect where and when an area of memory is being read or written can be a great help for investigators, even when the code base is well understood. Without this tool, a C++ developer could have a potentially daunting task of tracking where and when a global variable is accessed, and debugging those functions. Data breakpoints allow a C++ programmer to track when a variable / memory location is read or when it is written. When the operation is detected, the debugger will halt the execution and the line of code following the operation will be displayed in the code editor.
Access
|
Ribbon |
Execute > Windows > Breakpoints |
Detect operation on memory address
Step |
Action |
See also |
|---|---|---|
|
1 |
Click the |
|
|
2 |
Enter the memory address to watch. You can copy an address from the Locals (Local Variables) window.
|
|
|
3 |
Select the operation to detect. If you select 'Write', the debugger will break when the address is written to. If you choose 'Read / Write', the debugger will notify you when the address is read or when it is written. |
|
|
4 |
Select the action to perform. If you choose 'Break', the debugger will halt the program and the line of code will be shown in the editor. If you choose 'Trace', the debugger will not halt execution, but log any operation on the address as it occurs. This output is displayed in the Debugger Window. |
|
|
5 |
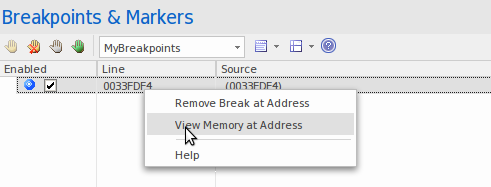
The data breakpoint is added to the Breakpoints and Markers window.
|
|
|
6 |
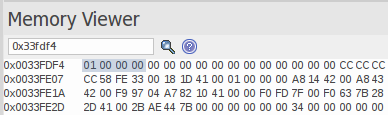
You can use the context menu on the data breakpoint to check the value at the memory address.
|
|
|
7 |
To delete a data breakpoint, select it in the Breakpoints and Markers window and press the . Alternatively, deselect the checkbox next to it. Data breakpoints are deleted when they are disabled; they do not persist as other breakpoints do. |
 button.
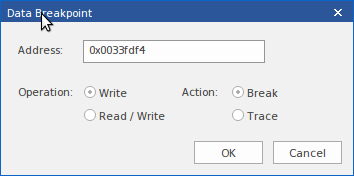
System Requirements
Memory address breakpoints are supported in the C/C++ native debugger.

