| Prev | Next |
Debugging
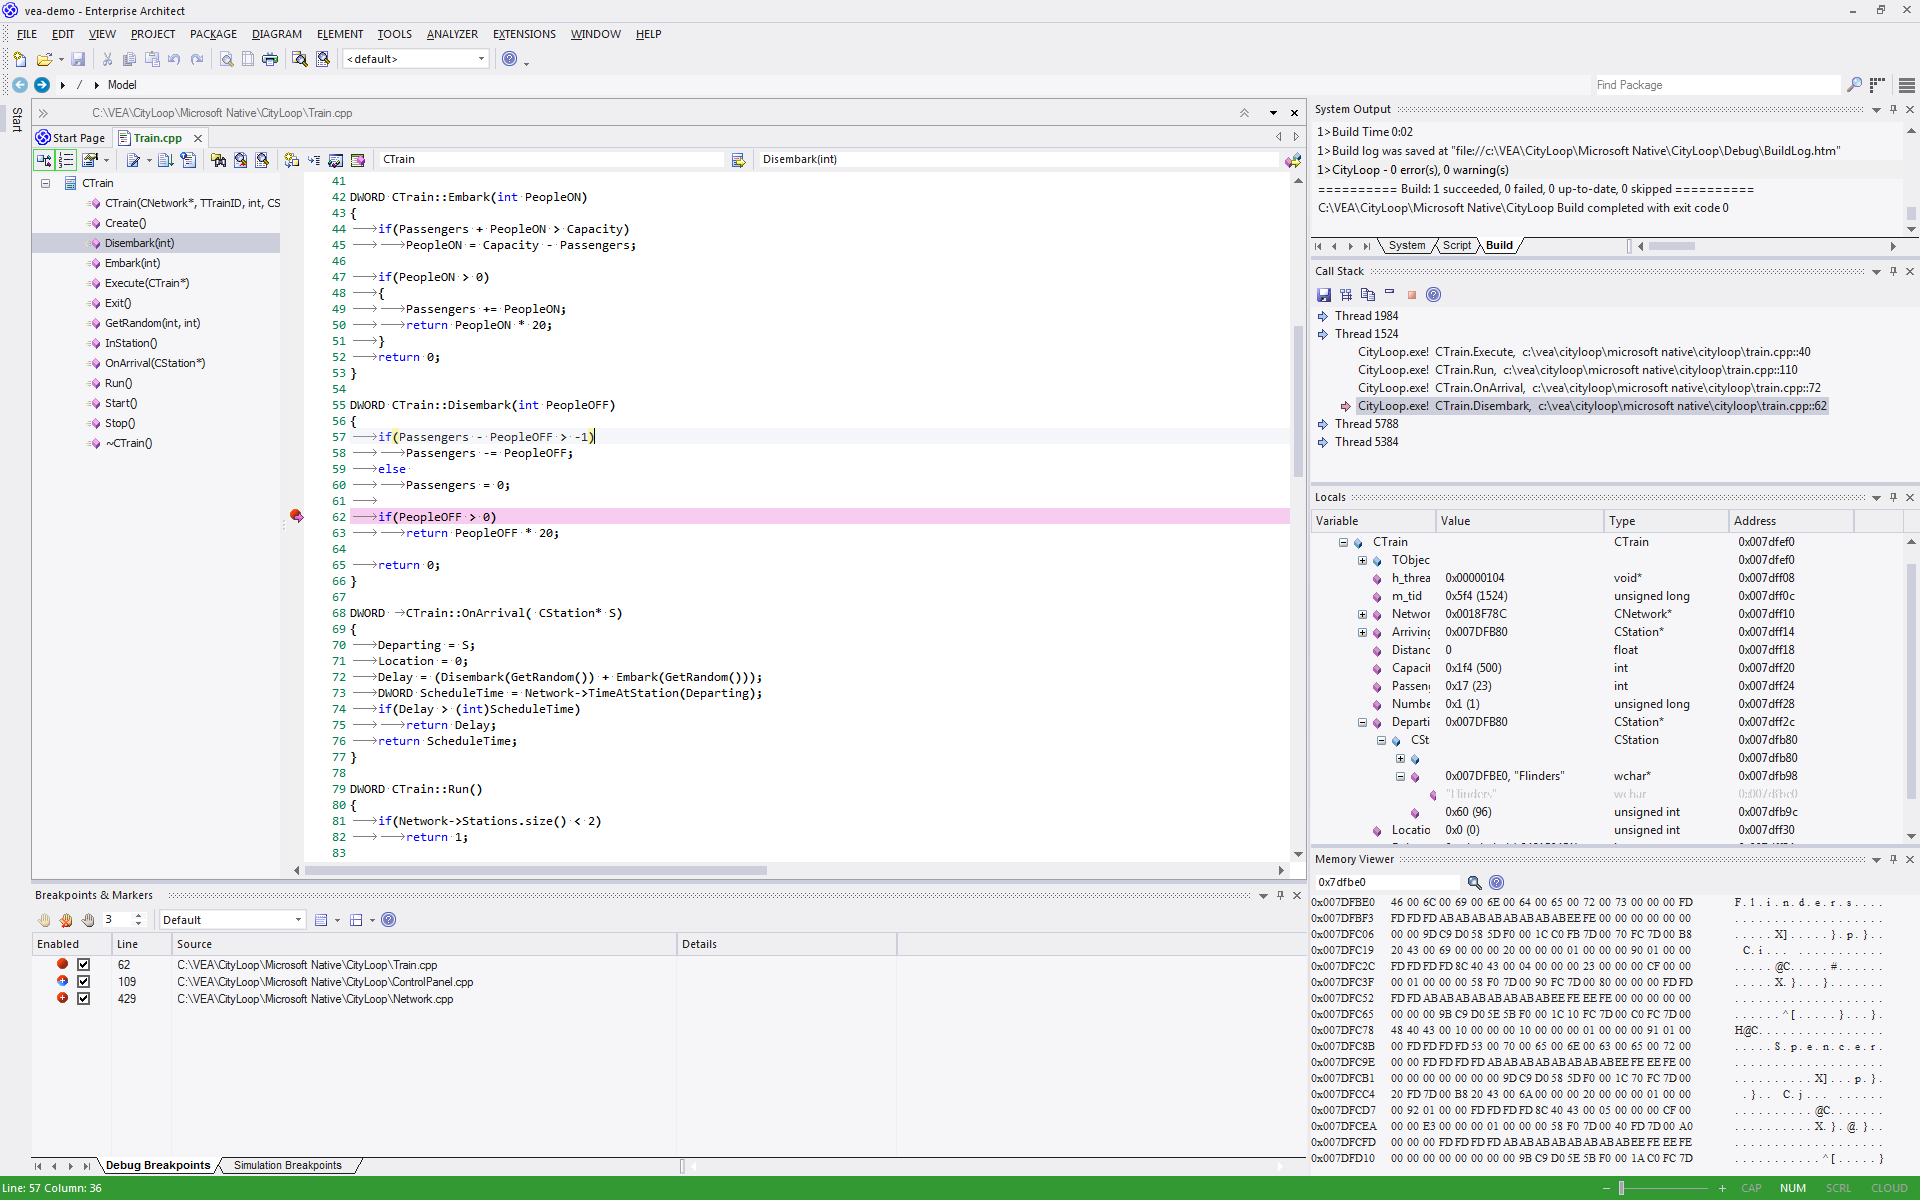
Enterprise Architect is more than a drawing tool. Every feature that you might expect in an IDE is also available. Comprehensive debugging environments and tools for many major platforms are provided. By integrating debugging capability within the modeling tool allows code to be developed, built and managed by its authors, working and collaborating in an integrated model has made actions count and every action accountable in ways that are just not possible using other tool chains.
Features
Speed
Debuggers in Enterprise Architect are quick! Stepping through programs will not take all day.
The Recording program execution can be done without manual stepping.
Support
- C++, C and Visual Basic
- Microsoft .NET, ASP.NET WCF
- Java, using socket transport (JDWP) or in memory model (JVMIT)
- Android on an emulator or device
- JavaSscript, VBScript and JScript
- PHP scripts on Apache web servers
- Remote Linux GDB processes using Enterprise Architect on Windows (how's that for interoperability?)
- Simulation - debug simulations in UML and BPMN
- Executable StateMachines - debug an executing StateMachine
Isolation
The debuggers operate out of process from Enterprise Architect, isolating it from side effects. (Your artifact is safe!)
Efficiency
Starting and stopping the debugger is quick and painless. It does not hold you back. Designed to be a responsive UI, the main UI thread is isolated from duties that are not its responsibility.
Productivity
Switch from modeling to requirements, from raising a change request to tracking code changes in a model shared across an organization, to profiling recent code changes. All in the one tool.
Notes

