| Prev | Next |
Generate, Save and Load Profile Reports
Reports can be produced at any time during a session, or naturally when a program ends. To enable the while the program is running, however, you need to suspend Profiling by toggling the , or by terminating the Profiler with the . You have some options for reviewing and sharing the results:
- View the report
- Save the report to File
- Distribute the report as a Team Library resource
- Attach the report as a document to an Artifact element
- Synchronize the model by reverse engineering the source code that participated in the profile
Access
|
Ribbon |
Execute > Analyze > Profiler > Create Report from Current Data |
|
Other |
From the Profiler window, click on the |
 icon in the toolbar.
CallFrequency Report
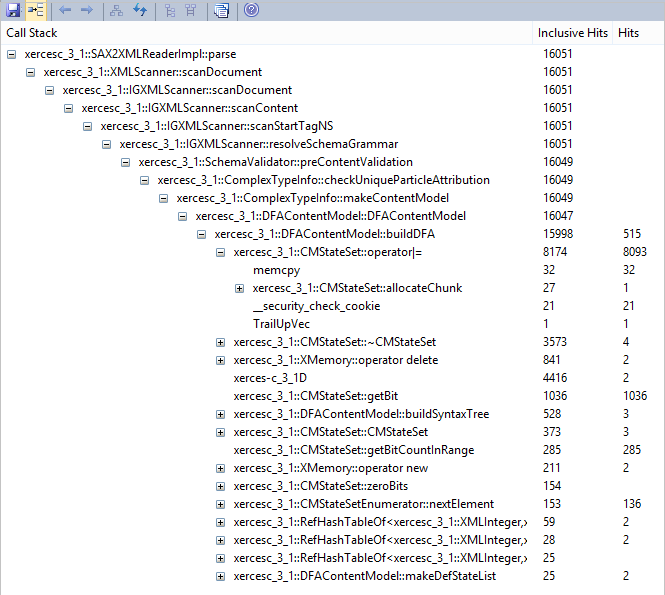
Function Summary
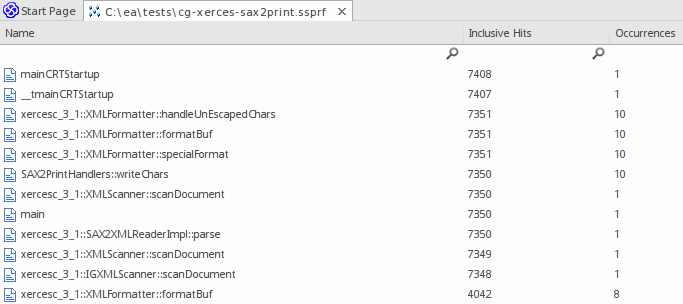
Unfiltered Summary Report listing all participating functions in order of inclusive hits.
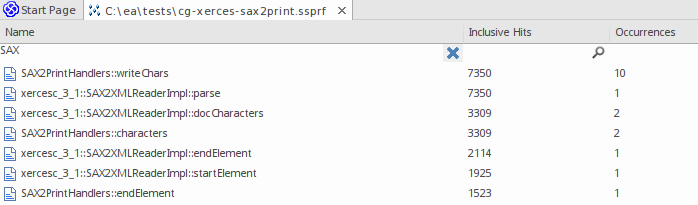
You can filter and reorganize the information in the report, in the same way as you do for the results of a Model Search.
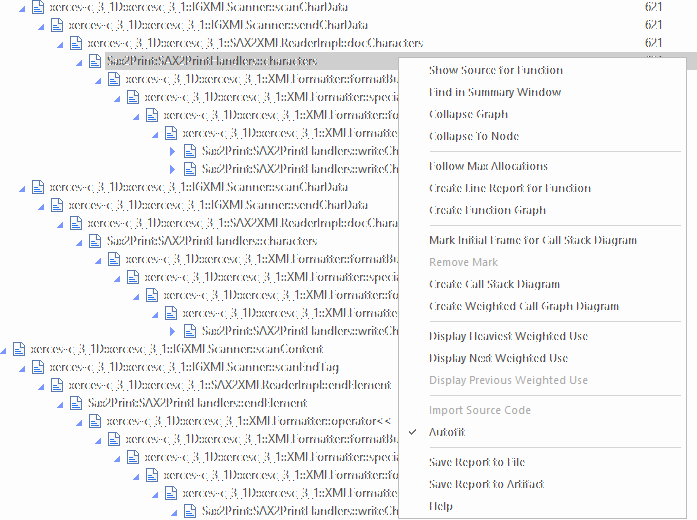
Report Options
Right-click on the report to display the context menu.
Action |
Detail |
See also |
|---|---|---|
|
Show Source for Function |
For the selected frame, select this option to display the corresponding line of code in a code editor. Frames that have source available are identifiable by their icon. |
Getting Started Customizing the Search View |
|
Find in Summary Window |
Select this option to locate the function in the 'Summary' tab. |
|
|
Collapse Graph |
Select this option to collapse the entire graph including child nodes, visible or not. |
|
|
Collapse to Node |
Select this option to collapse the entire graph, then expand and set the focus to the selected node. |
|
|
Follow Max Allocations |
Select this option to expand an entire line in the graph. |
|
|
Create Line Report for Function |
Select this option to launch the Profiler (if it is not already running), immediately bind the selected function and ready it for recording. Once bound, an extra tab is opened in the current Report View. This report will update instantaneously, showing the number of times each line executed. Of course, the report will continue to record activity in the function even if is not visible. Note: In windowed programs, it is usually necessary to take some action in the application to cause the function to be invoked. |
Function Line Reports |
|
Create Function Graph |
Select this option to create an additional tab, which shows the selected function in isolation. For a Call Frequency Profile, this produces a graph showing all the lines that led to this function being called (that is, the callers). For a Memory Profile, this produces a graph showing all lines that emanate from this function (that is, the callees). |
|
|
Mark Initial Frame for Call Stack Diagram |
Use prior to creating a Call Stack sequence diagram to limit the stack length. When this option is selected, the frame is marked and its text is highlighted. Frames above this one will then be excluded from any sequence diagram produced. |
|
|
Remove Mark |
Removes the mark from a frame that was previously marked as 'Initial'. |
|
|
Create Call Stack Diagram |
Generates a sequence diagram for a single stack in the graph. The selected frame is depicted as the terminal frame in the stack. The initial frame of the stack defaults to the root node if no 'Initial' frame has been marked. |
|
|
Create Weighted Call Graph Diagram |
Generates a sequence diagram that presents a sequence for each visible stack branching from the selected frame. By expanding and collapsing the nodes of interest, a user can tailor the sequence diagram content to their liking. |
|
|
Display the Heaviest Weighted Use |
Select this option to display the line in the graph with the highest weight in which this function appears. |
|
|
Display the Next Weighted Use |
Select this option to navigate to the next line in the graph where the function appears. You can use the shortcut key combination . |
|
|
Display the Previous Weighted Use |
Select this option to navigate to the previous line in the graph where this function appears. You can also use the shortcut key combination |
|
|
Save Report to File |
Select this option to display the 'Save As' dialog, allowing you to choose where to store the report. |
|
|
Save Report to Artifact |
Note: Before selecting this option, go to the Project Browser and select the Package or element under which to create the Artifact element. You are prompted to provide a name for the report (and element); type this in and click on the . The Artifact element is created in the Project Browser, underneath the selected Package or element. If you add the Artifact to a diagram as a simple link, when you double-click on the element the report is re-opened. |
Artifact |
Team Library Options
Option |
Description |
See also |
|---|---|---|
|
Make Report a Team Library Resource |
You can save any current report as a resource for a Category, Topic or Post in the Team Library to share and review at any time, as it is saved with the model. The report can also be compared with future runs. To begin this process, on the 'Team Library context menu select the menu option 'Share Resource | Add Active Profiler Report'. |
Work on Team Review Items |
Notes
Learn more

