| Prev | Next |
Memory Profile


- Quickly rate performance of activities that interest you
- Nothing influences a discussion more than evidence
- Reward your efforts by working in those areas that will make a difference
- Surprise yourself by delivering optimizations you might not have known existed
Usage
The Memory Profile can be used to reveal how activities perform in regard to memory consumption. Using this mode, a user would be interested in questioning the frequency of demands made for memory during a task. They would be less interested in the actual amount consumed. A well managed activity might make relatively few calls to allocate resources but allocate enough memory to do its job efficiently. Other activities might make many thousands of requests, and that typically makes them less efficient. This mode is useful for detecting those scenarios.
Operation
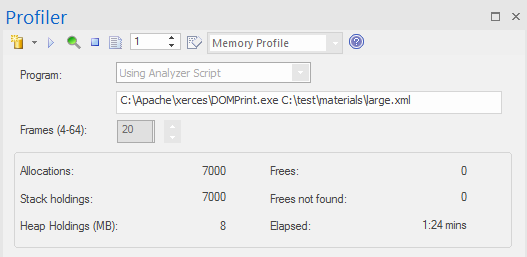
The Memory Profile works by hooking the process in question, so that program has to be launched using the tool in Enterprise Architect. Unlike the Call Graph option, you cannot attach to an existing process. When the program is started, hooking mechanisms track the allocation of memory; this information is collected and collated in Enterprise Architect. You can easily monitor the number of allocations being made. Also, the process is controlled; that is, the memory hooks can be turned on and off on demand. If you might have mistimed some action, you can pause capture, discard the data and resume capture again easily.
Results
Results can be produced at any time during the session; however, capture must be disabled in order for the to become active. It is your decision how long you let the Profiler run. You enable the Report button by either pausing capture or stopping the Profiler altogether.
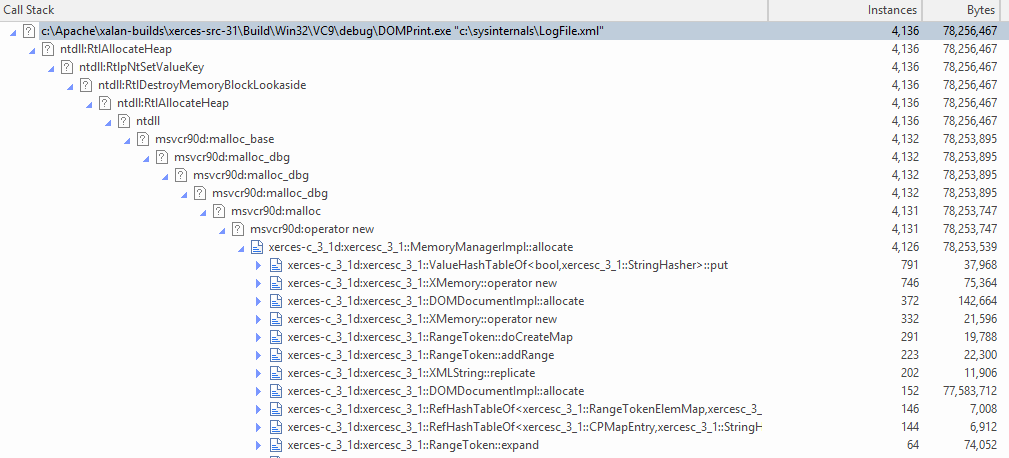
Results are displayed in a Report view. The report initially opens with two tabs visible; a single weighted Call Graph and a Function Summary. The Call Graph depicts all the Call Stacks that led to memory allocations, which are aggregated and weighted according to the frequency of the pattern.
Requirements
For best results, the image and its modules should be built with debug information included, and without optimizations. Any module with the Frame Pointer Omission (FPO) optimization is likely to produce misleading results.

