| Prev | Next |
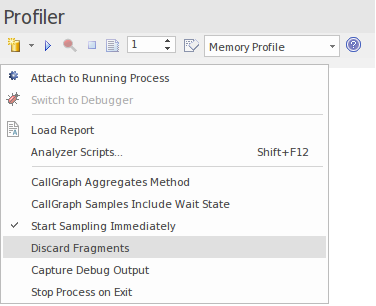
Setting Options

Call Graph Options
Option |
Description |
|---|---|
|
Interval |
Clicking on the up/down arrows, set the interval, in milliseconds, at which samples are taken of the target process; the range of possible values is 1 - 250 ms. |
|
Attach to Running Process |
Click on this option to select a running process. |
|
Switch to Debugger |
Click on this option to switch from Profiling to Debugging. The Debugger has an equivalent drop-down menu option that you can use to switch from Debugging to Profiling. |
|
CallGraph Aggregates Method |
When this option is selected, instances of the identical stack sequences are aggregated by method. That is to say, line numbers / instructions within a method are ignored, so two stacks will be counted as one where they differ only by line number in their final frame. |
|
CallGraph Samples Include Wait State |
When this option is selected, the Profiler will sample all threads, including those in Wait states. When unselected, the Profiler only samples threads that have accumulated CPU time since the last interval expired. |
|
Discard Fragments |
Sometimes, it just happens that the results of a stack walk operation can not be reconciled; that is, they do not appear to lead back to the entry point for the thread reporting the stack. We refer to these partial stack traces as 'fragments' and you can decide to display them or select this option to ignore them. |
|
Capture Debug Output |
Applies to Process Sampling. When selected, output normally visible during debugging is captured and displayed in the Debugger window. Note that only debug builds will typically emit debug output. |
General Options
Option |
Description |
|---|---|
|
Load Report |
Select this option to load a previously saved report from the file system. |
|
Analyzer Scripts |
Select this option to open the Analyzer Script window, which is the model repository for configuring builds, debugging, and all other Visual Execution Analyzer options. |
|
Start Sampling Immediately |
Select this option to trigger Data Collection immediately on launch. You would typically use this option to profile a process during startup. |
|
Stop Process on Exit |
This option determines termination behavior for the Profiler. When the option is selected, the target process will terminate when the Profiler is stopped. |


