| Prev | Next |
Define a Time Series Chart
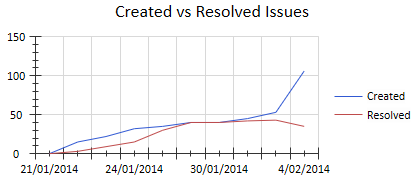
Your model contains a great deal of information on both project design and project management, and a major benefit of the Chart feature is providing the facility to capture, summarize and present that information. Using the Time Series Chart you can record changes in multiple series of data over time. Each series corresponds to an SQL Query that you can either run manually or update automatically on a schedule run by the Cloud service. The value of each series is plotted on the line graph on the day or at the time it was collected.
As an example, you might generate the Chart manually on different days, running two Queries showing Issues created and Issues resolved, for comparison. The Chart might resemble this:
After defining the content of the Time Series Chart, you can modify its appearance on the 'Appearance' page of the element's 'Properties' dialog.
Access
Select a Time Series Chart element on a diagram or in the Project Browser, then use any of the methods outlined here to open the Chart element's 'Properties' dialog.
On the Chart 'Properties' dialog, display the 'Source' tab.
|
Ribbon |
Design > Element > Properties > Properties Dialog > Source |
|
Context Menu |
Right-click on element | Properties | Source |
|
Keyboard Shortcuts |
| Source |
|
Other |
Double-click on element | Source |
Define Content
Field/Button |
Action |
See also |
|---|---|---|
|
Model |
Defaults to the current model as the source of the data for this Chart. If the data is held in a different model, click on the
If you want to return to the current model as the data source, select the 'Current Model' menu option. |
Server Based Repositories Cloud Based Repositories File Based Projects |
|
Element |
If you have selected a different model as the source of data, you can link your current chart to an existing Time Series chart in that other model. Click on the If there are too many Time Charts to review quickly, you can use the 'List Header' facilities to filter the list. To cancel the selection of an element, click on the |
List Header |
|
Details |
When you have selected a different model or project to open, this field shows the connection path for that model. |
|
|
Package |
To generate the Chart on the entire project, leave this field blank or click on the Otherwise, click on the This field is disabled if the 'Element' field has a value. |
Select |
|
Include Child Packages |
If you have specified a Package, select this checkbox to extract information from the child Packages of that Package. Clear the checkbox to ignore any child Packages when extracting information from the parent Package. |
|
|
Data Point Interval |
Click on the down-arrow and select either:
This field is disabled if a model other than the current model is selected in the 'Model' field. |
|
|
Exclude Weekends |
Enabled when the 'Data Point Interval' field is set to 'Daily'.
|
|
|
Run On |
Enabled when the 'Data Point Interval' field is set to 'Weekly' or 'Monthly'. If that field is set to:
|
|
|
Series |
Lists the SQL Queries that will be run whenever the Chart is regenerated. This panel also shows the date on which the Query was last executed, and the number of records displayed as a result. |
|
|
Edit |
Click on an SQL Query name in the 'Series' list and click on this button to edit the Query. The 'Edit Series' dialog displays; see the Edit Series Dialog table. |
|
|
Add |
Click on this button to add a new SQL Query to the 'Series' list, to be executed when the Chart is regenerated. The 'Edit Series' dialog displays; see the Edit Series Dialog table. |
|
|
Remove |
Click on an SQL Query in the 'Series' list and click on this button to delete the Query as a source of information for the Chart. A confirmation prompt displays. Click on the to delete the Query. |
|
|
Manual Record |
If you have set the 'Data Point Interval' field to 'Manual', click on this button to regenerate the Chart. The 'Results' column in the 'Series' list updates (if changes have occurred); the Chart itself does not change until you click on the to close the dialog. |
|
|
OK |
Click on this button to scan the specified Packages, close the dialog and generate the Chart. |
|
|
Cancel |
Click on this button to abort the changes and close the dialog. The aborted changes include updates to the 'Results' column if you have clicked on the . |
 button and select the appropriate menu option to:
 Edit Series Dialog
Field/Button |
Action |
See also |
|---|---|---|
|
Examples |
(Optional) Click on the drop-down arrow and select an example SQL Query to use intact or to edit to suit your requirements. |
|
|
Series Name |
Type a name for the SQL Query, to use as a reference to the Query in the 'Series' list on the 'Source' page. |
|
|
Query |
Type the text of the SQL Query. |
Create Search Definitions |
|
Test Query |
(Optional) Click on this button to test the Query you have written or updated. A message displays to confirm that the Query was successful or to identify that problems exist. |
|
|
OK |
Click on this button to save the Query, close the dialog and add or update the Query in the 'Series' list on the 'Source' page. |
|
|
Cancel |
Click on this button to abort the changes, close the dialog and return to the 'Source' page. |
Learn more

