| Prev | Next |
Chart Elements
The starting point for defining your own data charts is to drag one of the Chart element icons from the Diagram Toolbox onto your diagram. The Chart icons are divided into two groups:
- Patterned Pie Charts, Bar Charts, Heat Maps, Series Charts and Model Views, which create Charts ready-defined for specific purposes and just require small adjustments to tailor them for your project data
- Basic templates for Standard Charts (Pie Charts, Bar Charts and Heat Maps), Time Series graphs and Model View tables, which create Charts that you develop to meet your own requirements
Both groups of icons are available from the 'Dashboard' pages of the Diagram Toolbox. Basic template icons are also available from the common 'Artifacts' page of the Diagram Toolbox.
Additionally, you can obtain a selection of sample Charts (reporting on Issues and Defects) together on a diagram by selecting the 'Dashboard: Issues and Defects' checkbox in the Model Wizard. This Pattern is in the Core Extensions Technology group, and provides:
- Two Model View Charts
- A Pie Chart
- A 2D Bar Chart and
- A Time Series Chart
Initial Appearance
The Chart element initially displays as a 'normal' element, as shown:

However, depending on which type of Chart icon you select, the element either immediately transforms to the Chart and its 'Properties' dialog automatically displays, or you select to display the 'Properties' dialog and, once you identify the Chart type and contents, the element becomes the Chart you have defined; for example:
This Chart image is dynamically generated - it shows the selected properties of the model elements at the moment:
- The definition is saved, or
- The element's parent diagram is opened, or
- You right-click on the element in the open diagram and select the 'Refresh Chart' or 'Refresh List' menu option, or
- For TimeSeries Charts, either when the Cloud server is triggered by the update timetable you have defined in the Chart properties, or when you click on the in the 'Properties' dialog
You can add a Chart element to any existing diagram, and any number of these elements to one diagram. To make the Charts clear, easy to locate and simple to report on, you might store your Charts:
- On dedicated Dashboard diagrams, the diagram having the same name as a Chart it contains
- Where Charts are not related or for comparison, with just one Chart element per diagram (the Chart depictions are, however, very clear within quite small Chart elements)
- Within a child Package of the Packages that they report on
Define Chart
You define the Chart represented by an element using the element's 'Properties' dialog. On the 'General' page of the dialog, notice that the element has a stereotype: Chart, TimeSeriesChart or ModelView.
You define a Time Series Chart and a Model View Chart each in a specific way. You define a Standard (Pie, Bar or Heat Map) Chart in three stages:
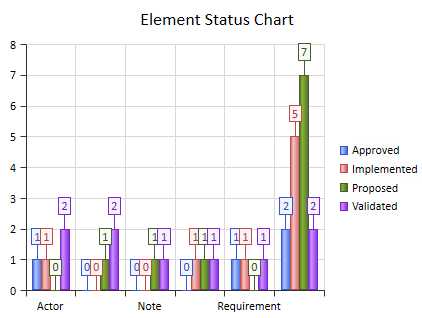
- Double-click on the element to open the 'Properties' dialog, and (if the Chart does not already have a specific name) on the 'General' page type in the function of the Chart as its name; for example, Element Status Chart.
- Select the 'Chart Details | Source' page and define the type of Chart, the type of data you want the Chart to show, and the source of that data.
- Select the 'Chart Details | Appearance' page and define exactly how you want the Chart to display on the screen and in reports.
Learn more

