| Prev | Next |
Roadmap Diagram
Getting to know the Roadmap Diagram
Aspect |
Description |
|---|---|
|
Introducing the Roadmap Diagram |
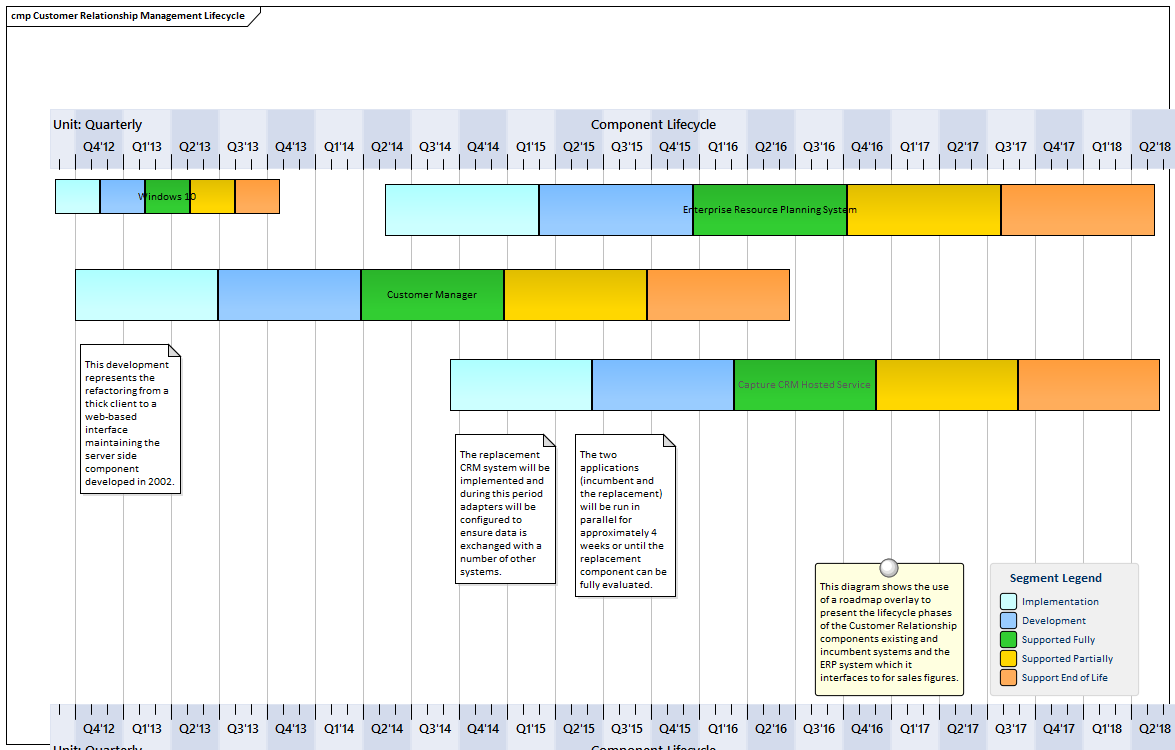
The Roadmap diagram is an overlay that can be applied to any diagram to describe significant phases in elements and how they change with the passage of time.
There is no restriction on the type of element that can appear on the diagram, and any diagram can have a Roadmap overlay defined. Significant user defined phases in the element's lifetime are represented by colored bars, which can be set to show duration. The colors and the phases can be configured using a Diagram Legend, which automatically applies them to the elements in the diagram. They are particularly useful for Enterprise Architecture diagrams for describing capability and application Roadmaps. |
|
Where to find the Roadmap Diagram |
Ribbon: Layout > Diagram > Roadmap Diagram Context Menu: Roadmap |
|
Usage of the Roadmap Diagram |
The Roadmap diagram has a wide range of uses from Enterprise Architecture where they can be used to show application and capability roadmaps to Systems Engineering, where they are used to show timing in low level components. |
|
Options for the Roadmap Diagram |
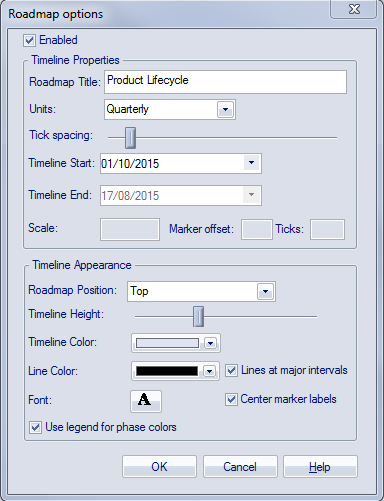
The Roadmap overlay has a range of options that determine the properties of the timeline, such as the scale of the time rulers, units, their positions, and the appearance of the time line including fonts and colors. The height and position of the timeline can also be configured to suit the diagram and display.
The Diagram Legend can be configured to define the phases in the elements lifetime and to set the specification of the colored bands and more. Roadmap segments can be shown or hidden on individual elements in cases where a particular segment might not apply to one or more of the elements on the diagram. |
|
Learn more about the Roadmap Diagram |