| Prev | Next |
Organizational Chart Diagram
Getting to know the Organizational Chart Diagram
Aspect |
Description |
|---|---|
|
Introducing the Organizational Chart Diagram |
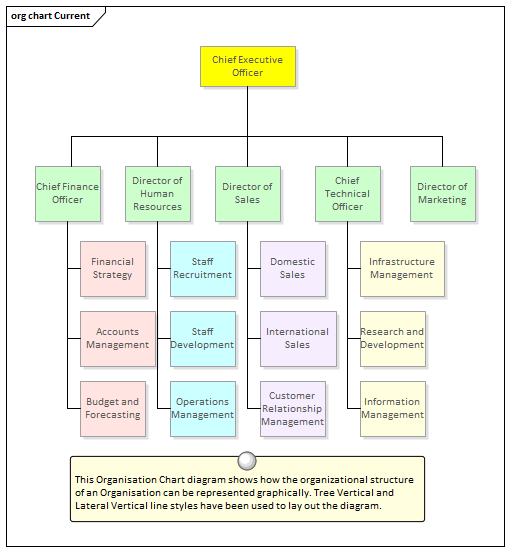
An organizational model is a powerful tool that is a visual representation that describes the roles, responsibilities and the reporting structure of an organization. It is invaluable to a Business Analyst as it allows them to visualize and to understand who they need to communicate with while performing various tasks. The Organization Chart in Enterprise Architect is flexible and can be used to create any type of representation including the inclusion of images representing teams or individuals.
|
|
Where to find the Organizational Chart Diagram |
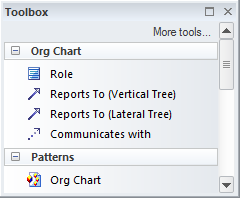
Ribbon: Design > Diagram > Insert > Strategic Modeling > Org Chart Project Browser Toolbar : New Diagram icon > Strategic Modeling > Org Chart Project Browser context menu | Add Diagram... > Strategic Modeling > Org Chart |
|
Usage of the Organizational Chart Diagram |
The Organizational Chart can be used to create any type of chart, including a Functionally Orientated, Market Orientated or Matrix Model chart. A number of charts could be created, representing different current and future states of the enterprise. |
|
Options for the Organizational Chart Diagram |
Apart from the relationships that represent reporting lines in the Organizational Chart, Business Analysts can also add relationships of authority, influence, and communication, which might not overlay the reporting lines. These additional lines can be modeled using named Associations and stereotyped if required.
The Organizational Chart (like any diagram) can be viewed as an element list, which makes working with the element's properties easier. Diagram Filters can also be used when presenting the diagrams, to draw attention to parts of the diagrams; the diagrams can be presented as hand drawn or in a whiteboard style by changing the properties of the diagram.
|
|
Learn more about the Organizational Chart Diagram |