| Prev | Next |
Decision Tree Diagram
Getting to know the Decision Tree Diagram
Aspect |
Description |
|---|---|
|
Introducing the Decision Tree Diagram |
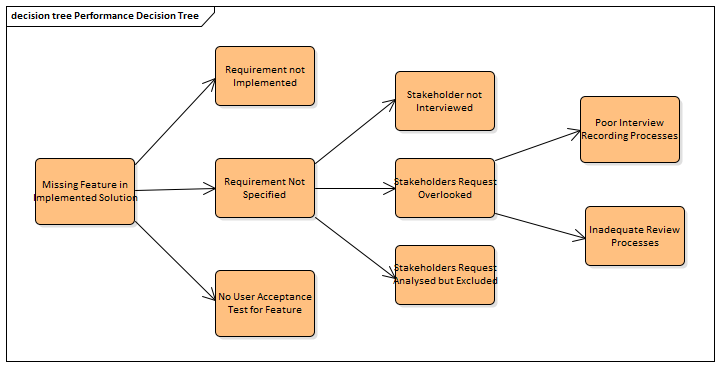
Decision Trees are an effective way of graphically representing a number of options and provide a mechanism to investigate the possible outcomes and benefits of choosing those options. They can also assist the analyst to form a balanced picture of the risks and benefits associated with each possible course of action. They are a close cousin of the Decision Table but have the benefit of being graphical. Enterprise Architect has a purpose built diagram allowing complex decisions to be modeled and displayed including probabilities and uncertainty.
|
|
Where to find the Decision Tree Diagram |
Ribbon: Design > Diagram > Insert > Strategic Modeling > Decision Tree Project Browser Toolbar : New Diagram icon > Strategic Modeling > Decision Tree Project Browser context menu | Add Diagram... > Strategic Modeling > Decision Tree |
|
Usage of the Decision Tree Diagram |
Decision Trees can be used to help in decision making processes particularly when the decision involves a complex set of conditions that have different likelihoods of occurrence. They can be used for strategic or operational decision analysis and can help to formalize the basis of decision making particularly when it is imperative that actions that are taken are based on formal analysis or have expensive consequences. A Decision Tree can be used to present a graphical picture of a Decision Table for stakeholders who are more comfortable viewing diagrams rather than tables and documents. |
|
Options for the Decision Tree Diagram |
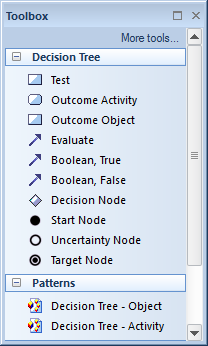
Decision trees can be drawn with varying levels of formality from simple trees with a series of decisions resulting in outcomes to more formal trees that involve uncertainty with probability values assigned or formulaic expressions with input parameters. The 'Decision Tree' toolbox page contains a range of elements that can be used, and two Patterns that can be used to create a diagram giving the analyst a starting point.
Diagram Filters can also be used when presenting the diagrams to draw attention to parts of the diagrams and the diagrams can be presented as hand drawn or in a whiteboard style by changing the properties of the diagram. |
|
Learn more about the Decision Tree Diagram |