| Prev | Next |
View the Local Variables
The Locals window displays variables of the executing system. Whether you are recording C#, debugging Java, C++ or VBScript, debugging an Executable StateMachine, or running a simulation, this window is where the system's variables are located. Current values are only displayed when a program is halted. This occurs when a breakpoint is encountered during debugging, when you step over a line of code or when you step between States in a simulation.
Access
|
Ribbon |
Execute > Windows > Local Variables Simulate > Core > Local Variables |
|
Context Menu |
In Code Editor | Right-click on any variable identifier > Display Variable |
Icons
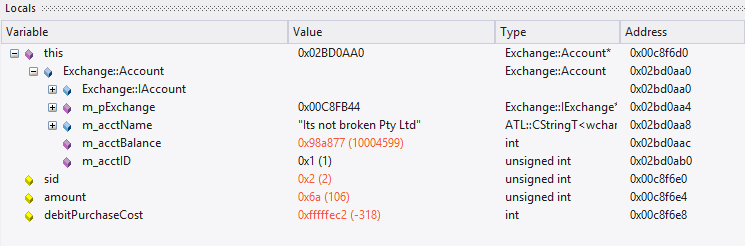
The value and type of any in-scope variable is displayed in a tree; each variable has a colored box icon that identifies the type of variable:
- Blue - Object with members
- Green - Arrays
- Pink - Elemental types
- Yellow - Parameters
- Red - Workbench instance
Finding variables
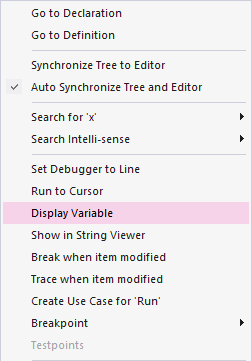
The easiest way to find a variable is to first locate it in the code editor and use the right-click context menu on the variable, selecting 'Display Variable'. Enterprise Architect will find and reveal any variable in scope, including deeply nested members. If the variable is found in a different scope (global, file, module, static), it will be displayed in the Watches window (see View Variables in Other Scopes).
Persistent View
The examination of variables usually involves digging around in the tree to expose the values of interest. It can be annoying then, having gone through that trouble, to step to the next line of code, only to have those variables buried from sight again due to a change in context. The Locals window has a persistent view that lingers for a while after a run or step command. When you step through a function in Enterprise Architect, the variables structure persists line after line. This makes stepping through a function quick and easy.
What changed
As part of the persistent view, the Locals window tracks changes to values and highlights them.
Context Menu
Facility |
Detail |
See also |
|---|---|---|
|
Break When Variable is Modified |
Set data breakpoints on the selected memory variable to halt debugger execution at the line of code that has just caused the value of the variable to change. |
Break When a Variable Changes Value |
|
View Memory at Address |
Display the raw values in memory at the selected address, in hex and ASCII. |
Inspect Process Memory |
|
Show in String Viewer |
Display the variable string in the 'String Viewer' dialog. |
View Content Of Long Strings |
|
Dump Variable Members to File |
Capture and store the selected variables to a separate location; a browser displays to select the appropriate .txt file name and file path. |
|
|
Save Snapshot of Variable |
Capture the value of a variable at a specific point in the life of that variable. |
Variable Snapshots |
|
Compare Variable Snapshots |
Compare the values of a variable at different points in the life of that variable. |
|
|
Copy |
Copy the selected variable to the Enterprise Architect clipboard. |
|
|
Add Instance Run State to Diagram |
If you have opened a model diagram containing an Object of the Class for which the source code is being debugged, this option updates that Object with the Run State represented by the variable value. |
|
|
Set Conditional Breakpoint |
Add a breakpoint at the current execution position with a constraint for this variable matching its current value. |
Breakpoint Properties |
Learn more

