| Prev | Next |
BPSim - Step Page
After successfully running the execution, the user will get an execution report, which tells us the process status in general, e.g. the average time of a task, the total waiting time of customers, how many issues are repaired etc.
Besides, the user may inspect the process from various angle. For example:
- From timestamp angle: what was the status of this process at 9:30 AM?
- From token angle: What did the 3rd customer do in the shop?
- From property angle: How is the "number of issues" decreased and increased for the 2nd car?
- From multiple thread angle: May I see customers walk in and simulate automatically on the diagram?
- From Resource angle: When is a support busy/idle? Why is a customer waiting for 40 minutes?
All these kind of questions can be answered by the "Step Simulation" page.
Access
|
Ribbon |
Simulate > BPSIM > Open BPSIM Manager, Step Page |
Toolbar Options
Option |
Description |
See also |
|---|---|---|

|
Click on this button to simulate the process automatically based on the execution result. Click on menu "Set Speed for Replay" adjust the simulation speed. For example, input "60" means 60 times faster than actual, 1 minute in real life will be simulated in 1 second. |
|

|
Click on this button to pause the auto-replay simulation. |
|

|
Click on this button to exit the simulation mode. |
|

|
Click on this button to "step over" to a next timestamp. Each "step over" may contains multiple "steps". |
|

|
Click on this button to play a single step. This represent: a token's one movement in the process. |
|

|
Click on this button to generate a Timing Diagram for the simulation. The user may choose from the menus: Generate a single timeline for each token / Generate multiple timelines for each token. |
|

|
Click on this button to export the filtered records on this step page to a CSV file. The user may choose which tab to export. |
Tokens Page
After running the execution, this page will be filled with token information during the simulation, the sequence is in order of triggering time.
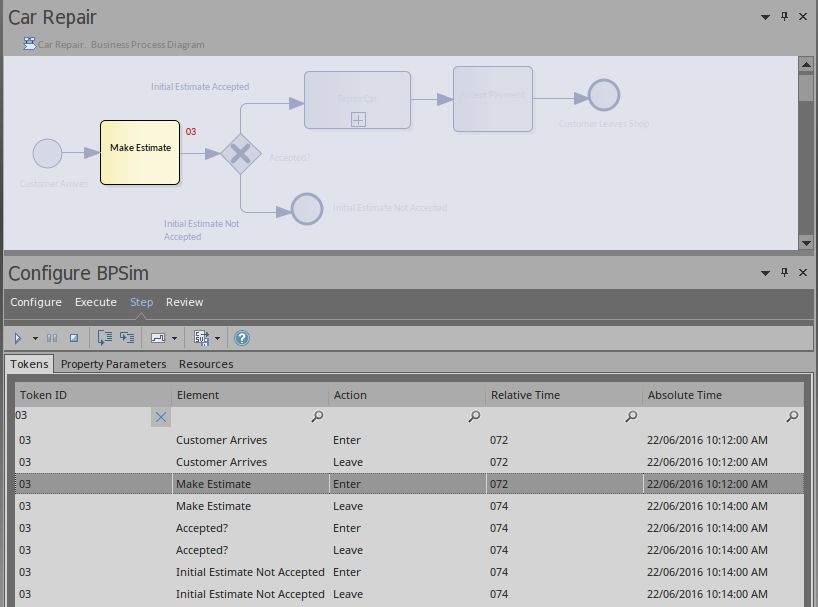
- Apply in the Token ID column will only show records for a specific token.
- One click on the button "step in" will play one record in the list.
- Double click on a record is equivalent to step run to that record from beginning.
- If time parameters are set on the elements, "step over" will run to the last record of the next time event.
- When a record in the list is played, the simulation snapshot will be showing on the diagram.
Property Parameters Page
While the records on the tokens page is played, the Property Parameters page will show the runtime value of properties at the timestamp.
For example, a BPMN process to calculate Fibonacci numbers may be modeled like this:

After defining property parameters, configure BPSim parameters for each element, execute the model, we are ready for the step simulation:
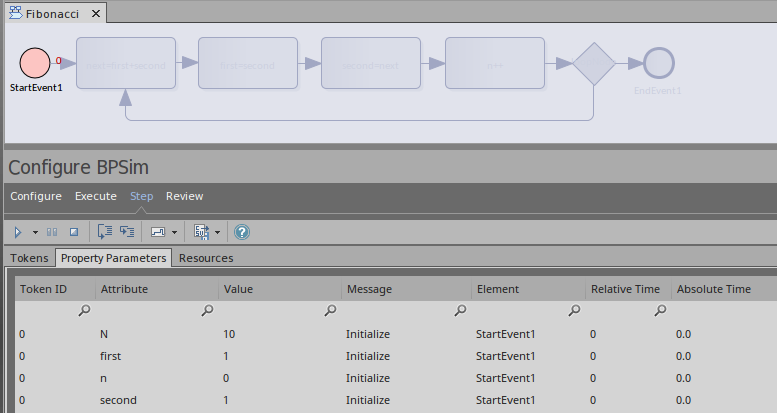
The "Message" column indicates that property "N, first, n, second" are initialized.
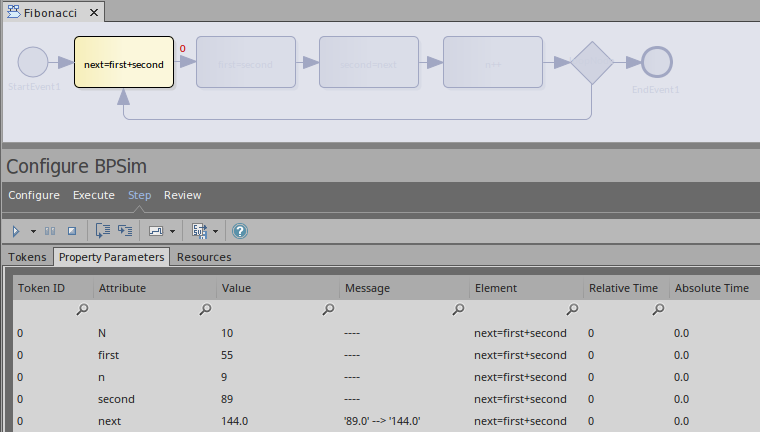
Keep clicking on the "step in" button, the properties in the list will change their values. This figure shows that on entering task "next = first + second", the value of property "next" changed from 89 to 144.
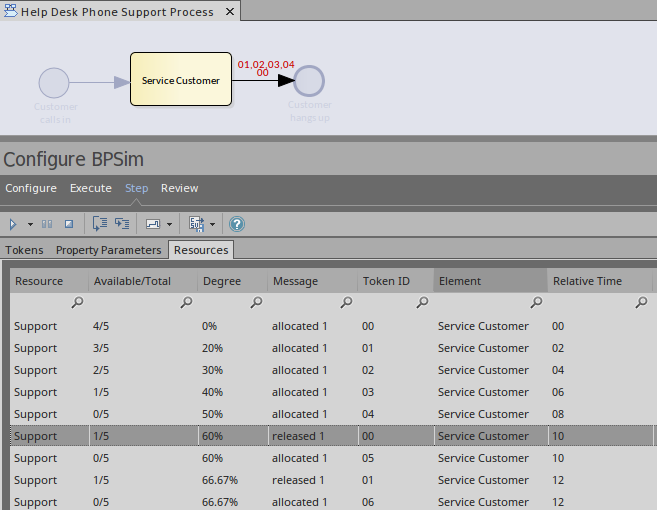
Resources Page
While the records on the tokens page is played, the Resources page will show the runtime resource available quantities and allocation/release events at the timestamp.
Generate Timing Diagram
When the time parameters are configured on the BPMN elements, EA will be able to generate a timing diagram for the simulation process.
- Generate a single timeline for each token
Use this option for "single threaded" process. E.g. no parallel gateway, event sub processes etc.
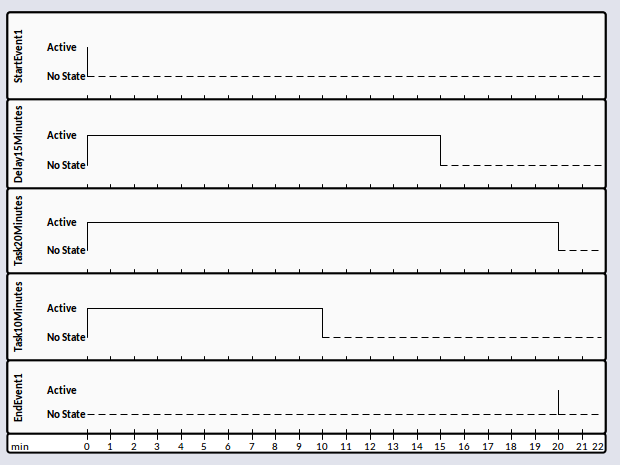
- Generate multiple timelines for each token
Use this option in cases when the "Generate a single timeline for each token" do not apply.
For example:
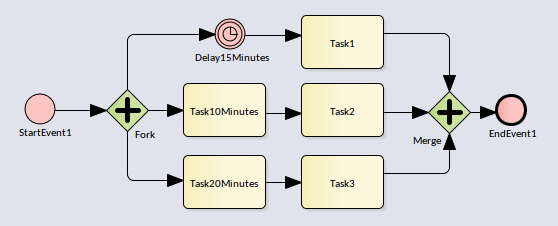
Execute this model and click "Generate multiple timelines for each token", the generated timing diagram looks like this:
Learn more

