| Prev | Next |
CSV Data
Although your model contains a great deal of information on both project design and project management, you might want to check or present the status of some external spreadsheet data for comparison or for review before importing it into your model. A major benefit of the Chart feature is providing the facility to quickly paste in and display, in the appropriate Chart format, the contents of an external CSV file.
Before you start, copy the content of the CSV file to the clipboard.
Access
Select a Chart element on a diagram or in the Project Browser, then use any of the methods outlined here to open the Chart element's 'Properties' dialog.
On the Chart element's 'Properties' dialog, click on the 'Source' tab, then on the 'CSV' child tab.
|
Ribbon |
Design > Element > Properties > Properties Dialog > Source > CSV |
|
Context Menu |
Right-click on element |Properties | Source| CSV |
|
Keyboard Shortcuts |
| Source| CSV |
|
Other |
Double-click on element | Source| CSV |
Review External CSV Data
Field/Button |
Action |
See also |
|---|---|---|
|
panel |
Right-click on the panel and select the 'Paste' option to paste the contents of the CSV file. If necessary, edit the data so that the first row defines the series name, in the format: Series,Name1,Name2,Name3... Edit the first column to represent the series object (the objects listed along the x-axis of the Chart). You need perform only very basic editing on the text. |
|
|
OK |
Click on this button to process the data, close the dialog and generate the Chart. |
|
|
Cancel |
Click on this button to abort the changes and close the dialog. |
Output
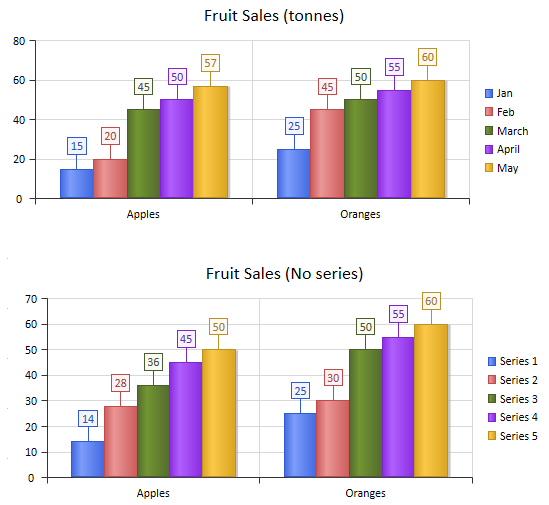
Using simple CSV input such as this, for two chart elements Fruit Sales (tonnes) and Fruit Sales (No Series), two bar charts were created.
Series,Jan,Feb,March,April,May
Apples,15,20,45,50,57
Oranges,25,45,50,55,60

The CSV data for Fruit Sales (tonnes) provides a label for the series, essentially the aspect being compared (the sales for each month). The data for Fruit Sales (No series) omitted the first line of information, so the chart defaults to an unnamed series set.
Learn more

