| Prev | Next |
Recording
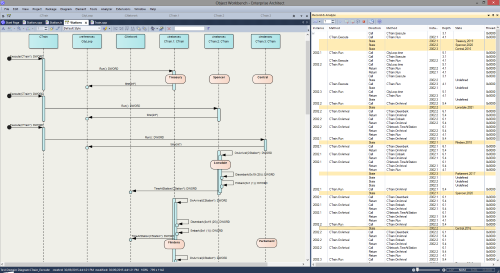
Sequence diagrams are a superb aid to understanding behavior. Class Collaboration diagrams also can be helpful. In addition to these, sometimes a Call Graph is just what we need. Then again, if you have this information available, you could use it to document a Use Case, and why not build a Test domain while you are at it? The Enterprise Architect Analyzer can generate all of these for you and from a single recording. It does this by recording a running program, and it works on all of the most popular platforms.
Access
|
Ribbon |
Execute > Analyze > Recorder > Open Recorder |
Overview
At its simplest, a Sequence diagram can be produced in very few steps using even a brand new model. You do not even have to configure an Analyzer Script. Open the Enterprise Architect code editor (), place a recording marker in a function of your choice, and then attach the Enterprise Architect debugger to a program running that code. Any time that function is called, its behavior will be captured to form a recording history. From this history these diagrams can be easily created.
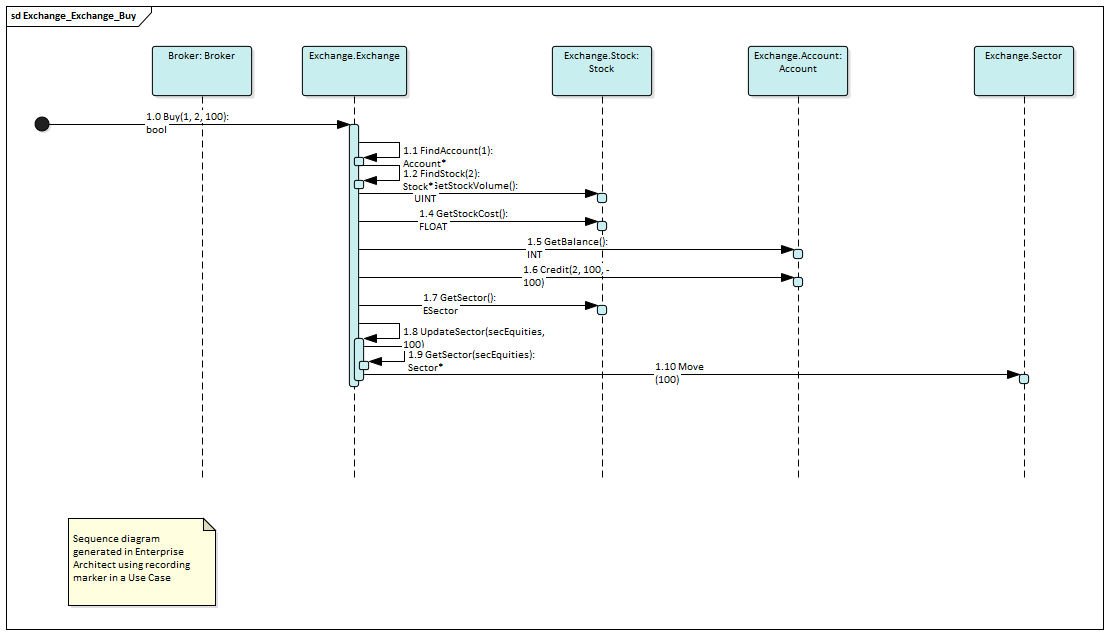
The Sequence diagram from the Example Model recording.
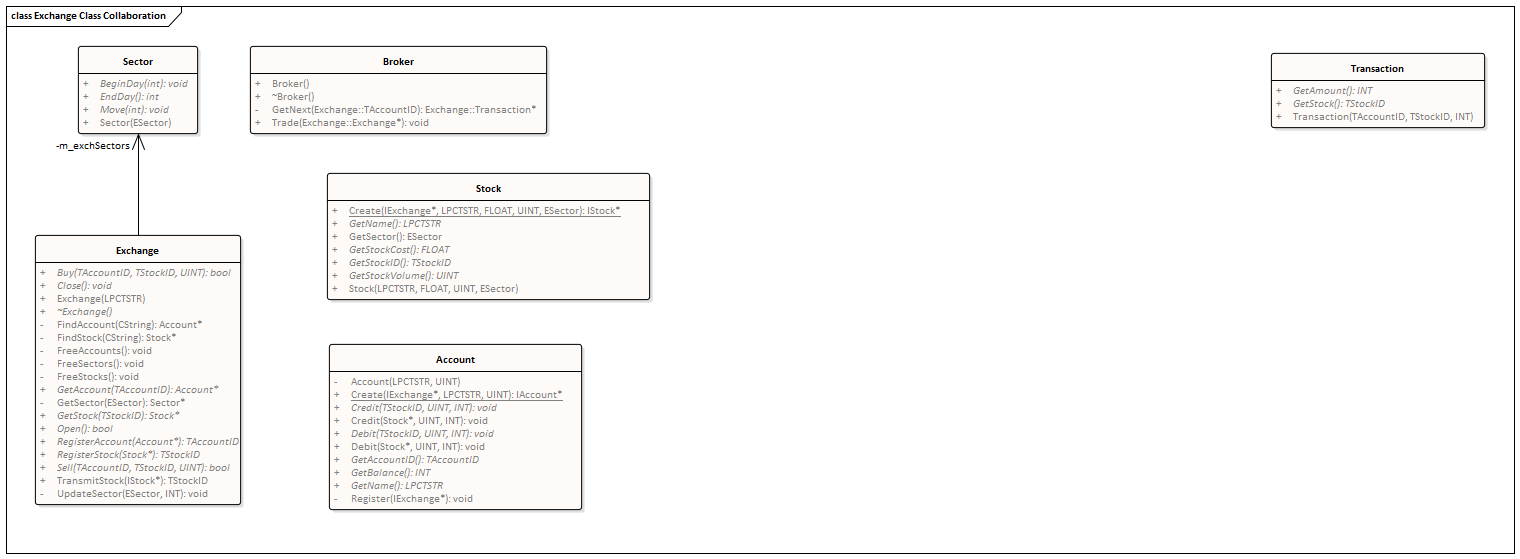
The Class Collaboration diagram from the same recording.
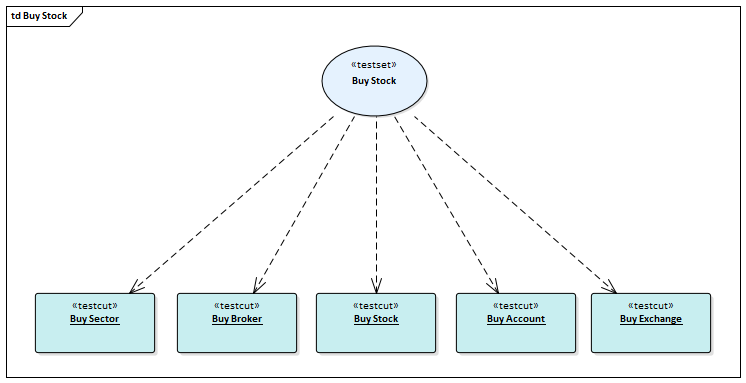
The Test Domain diagram from the same recording.
Of course, an Analyzer Script is still the best idea, and opens up an incredibly rich development environment, but it is worth noting that significant results can be obtained without one. This is also true of the Enterprise Architect Debugger and Profiler tools.
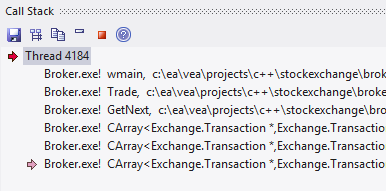
A point of interest: you can view a thread's behavior while it is recorded. Showing the Call Stack during a recording will show updates to a thread's stack in real-time, much like an animation. It is a good feedback tool and in some circumstances it might be all that is required.
Features at a glance
Diagram Generation
- Sequence diagram
- Class Collaboration diagram
- Test Domain diagram
- State Transition capture
- Call Graph
Control
- Support multi-threaded and single-threaded models
- Support stack depth control

- Support filters to restrict capture
- wildcard support
- Real-time stack update
Integration
- Class Model
- Test Domain
- StateMachine
- Executable StateMachines
- Unit Tests
Platforms
Requirements
Notes

