| Prev | Next |
How it Works
This topic explains how the Visual Execution Analyzer generates Sequence diagrams.
Explanation
Points |
Detail |
See also |
|---|---|---|
|
Usage |
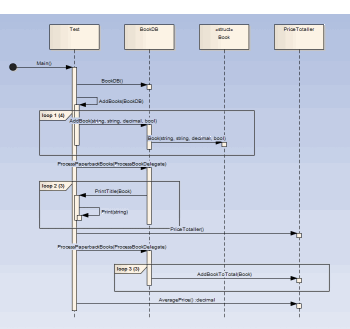
The Visual Execution Analyzer enables you to generate a Sequence diagram from recordings of the live execution of an application. As the application runs, the history of each thread is recorded. This history can be used to generate the Sequence diagram. This is a Sequence diagram generated from a program that calculates the price of books:
How does the recorder know what to record? - The recorder works from recording markers; these are placed by you in the functions of interest Call Stacks in Java can stretch further than the eye can see. How can we restrict the recording to just ten frames? - The recorder is controlled by the depth either set on the recorder toolbar or associated with a Marker Set stored in the model |
The Recording History Diagram Features |
|
Its the real thing |
In recording, the target application is not modified; no instrumentation of any image or module occurs at all. A recording produced using a 'Release' build of a program is as trustworthy a document as any of what a program did. |
|
|
Where do you start |
We have a very large server application; so where do we start? If you have little or no understanding of the program you intend to record and little or no model to speak off, you might be best starting with the Profiler. Running the Profiler whilst using a program in a specific manner can quickly identify Use Cases from the entry points and Call Graphs presented. Having that knowledge can enable you to focus on areas that are uncovered and record those functions. If you have the source code, all you need to do is place a recording marker in a function that interests you. We recommend against placing multiple recording markers in multiple functions at the same time. In practice this has shown to be less helpful. Where do you place a recording marker? For windows UI programs, and in relation to some business use case, you might start by placing one in the event handlers for a message that seems most pertinent. If you are investigating a utility function, just set a method recording marker at or somewhere near the start. For services, daemons and batch processes you might want to profile the program once for each behavior of interest and use the report to explore those areas uncovered. |
|
|
Tip |
It's a good idea to have a quick glance at the Breakpoints and Markers window before debugging, and check that the markers listed here are what you are expecting. |
|
|
Scenarios |
|
Learn more

