| Prev | Next |
The Android Debugger
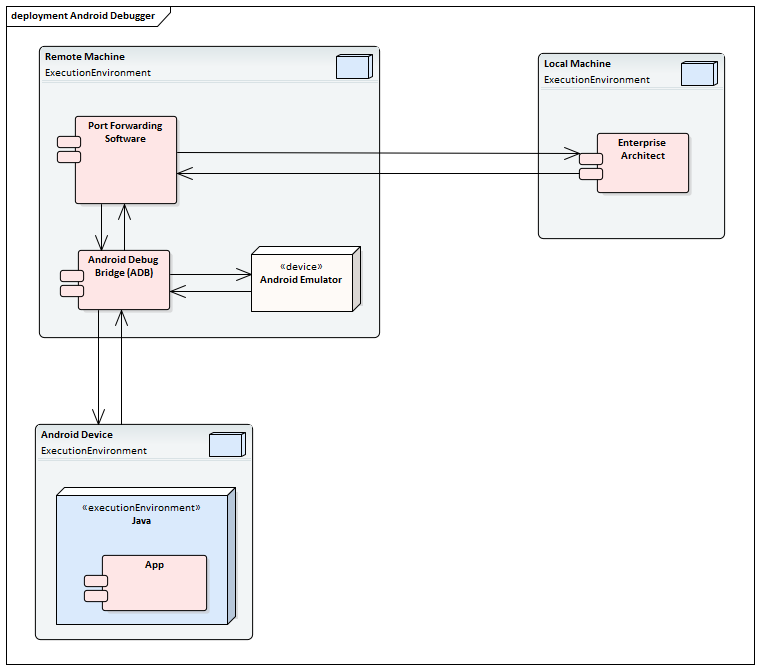
If you are developing Java applications running on Android devices or emulators, you can also debug them. The Local and Remote machines can be on either a 32-bit platform or a 64-bit platform.

System Requirements
On the Remote machine, this software is required:
- Android SDK, which includes the android debug bridge, ADB (you need to be familiar with the SDK and its tools)
- Java JDK (32 and 64 bit support)
- Port Forwarding software (3rd party)
On the Local machine, this software is required:
- Enterprise Architect Version 10 or higher
Analyzer Script Settings
Field/Button |
Action |
See also |
|---|---|---|
|
Debugger |
Click on the drop-down arrow and select Java (JDWP). |
|
|
Run |
Click on this radio button. |
|
|
Default Directory |
Not applicable - leave blank. |
|
|
Application path |
Not applicable - leave blank. |
|
|
Command Line Arguments |
Not applicable - leave blank. |
|
|
Build first |
Not applicable - leave blank. |
|
|
Show console |
Not applicable - leave blank. |
|
|
Show diagnostic messages |
Not applicable - leave blank. |
|
|
Connection |
Not applicable - leave blank. |
|
|
Port |
This is the application port, forward-assigned using adb or other means, through which Enterprise Architect and the Android Virtual Machine (VM) can communicate. |
Port Forwarding |
|
Host |
Host computer (defaults to localhost) If Android is running on an emulator on a device attached to a networked computer, enter the network name here. By default, debugging will attempt to connect to the port you specify on the local machine. |
|
|
Source |
This is the source equivalent of the classpath setting in Java. The root to each source tree should be listed. If more than one is specified, they should be separated by a semi-colon; that is:
c:\myapp\src;c:\myserver\src
You must specify at least one root source path. When a breakpoint occurs the debugger searches for the java source in each of the source trees listed here. |
|
|
Logging |
Enables logging additional information from debugger possible values: true,false,1,0,yes,no |
|
|
Output |
Specifies the full name of the local log file to be written. The folder must exist or no log will be created. The log file typically contains a dump of bytes sent between debugger and VM. |
|
|
Platform |
If you are debugging Java running under any android scenario, select Android. For all other scenarios, select Java. |
Configure Ports for Debugging - Port Forwarding (Local)
The debugger can only debug one VM at a time; it uses a single port for communication with the VM. The port for the application to be debugged can be assigned using ADB, which is supplied with the Android SDK.
Before debugging, start the application once in the device. When the app starts, discover its process identifier (pid):
adb jdwp
The last number listed is the pid of the last application launched; note the pid and use it to allow the debugger to connect to the VM:
- adb forward tcp:port jdwp:pid
- port = port number listed in analyzer script
- pid = process id of the application on the device
Configure Ports for Debugging - Port Forwarding (Remote)
To debug remotely the same procedure should be followed as for the local machine, but the communication requires additional forwarding as the socket created using the adb forward command above will only listen on the local adapter. The socket is bound to the localhost and attempts to connect to this port will be met with connection refused messages.
In order to achieve remote debugging it is necessary to have a proxy running on the remote machine that listens to all incoming connections and forwards all traffic to the adb port; there are numerous software products available to do this.
Remote debugging with Enterprise Architect will not work unless a proxy port forwarder has been configured by the user.

