| Prev | Next |
Marker Types
Markers are really fantastic. Unusual by their very light footprint when used with care, their impact on the performance of the programs being recorded can be negligible. Markers come in several flavors (well colors actually) and more are always being added. They are placed and are visible in the left margin of the editor, so you will need to have some source code.
Use to
Reference
Marker |
Detail |
See also |
|---|---|---|
|
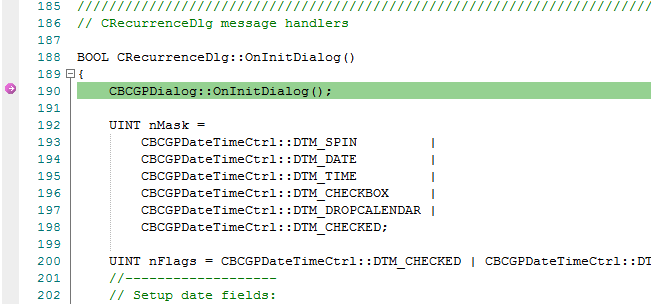
Start / End Recording markers |
Place the markers at the start and ending lines of the code to record. These need not be within the same function.
When the program encounters a start recording marker, a new recording is initiated (the camera starts rolling!). When an end marker is encountered, the current recording ends (it's a take). How you use these markers is up to you and your knowledge of the system under your care. Advanced Stuff (nested markers): If a Start recording marker is encountered while a recording is in progress but where capture is inhibited by the Stack depth value in use, a separate recording will be initiated. Each recording is kept on a stack. When one ends, it is removed. This technique can be used in Enterprise Architect to record and render scenes in very complex systems. It is rather like splicing short scenes from a video to create a trailer. If you only want to record a single function, you should use an Auto record marker. |
The Breakpoints & Events Window Analyzer Script Editor Control Stack Depth |
|
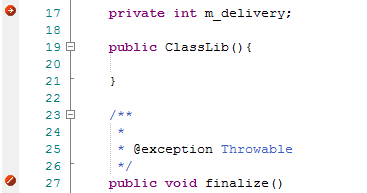
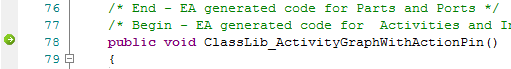
Method Auto Record marker |
A Method Auto Record marker enables you to record a particular function. The debugger will automatically end the recording when the function completes. This is good because recording is an intensive operation. The function marker combines a Start Recording marker and an End Recording marker in one, so recording is executed after the marker point, and always stops when this function exits.
Recording markers can be nested. When a new Method Auto Record marker is hit while recording, the stack depth to record to will be extended to include the current method and the required depth from that function. |
|
|
Stack Auto-Capture marker |
Stack markers enable you to capture any unique stack traces that occur at a point in an application; they provide a quick and useful picture of where a point in an application is being called from. To insert a marker at the required point in code, right-click on the line and select the 'Add Stack Auto Capture Marker' option. Each time the debugger encounters the marker it performs a stack trace; if the stack trace is not in the recording history, it is copied, and the application continues running. |
|
|
Limiting the recording depth |
You can limit the depth of frames in any recording using the stack depth control on either the recorder and breakpoints toolbars. |
Learn more

