| Prev | Next |
Testpoints
Testpoints present a scheme by which constraints and rules governing the behavior of objects can be taken from the model and applied to one or more applications. The advantages that schemes such as this offer are tolerance to code changes - adding and subtracting lines from a function has no effect on the constraints that govern it. Another advantage is that changes to the behavioral rules do not require a corresponding change to any source code; meaning nothing has to be re-compiled!
Also, the ability to verify multiple applications using a single test domain is a simple rather than onerous matter. The Test Domain is a both a logical and relational model; constraints in the Class model can be partitioned with Test Cuts. These can be aggregated simply into Test Sets and Test Suites using connectors. Due to the decoupling of the Test Domain from the codebase, it is a simple choice of buttons to run a program normally, or run it for a specific Test Domain. This system also delivers practical benefits in that no instrumentation is required at all. Test results are displayed in the report window during the run, in real-time, as the program runs. These results can be retained, and reviewed at any time in the Test Management window or using Enterprise Architect's documentation features.

Features
Feature |
Details |
See also |
|---|---|---|
|
Testpoint Composition |
Testpoint composition is performed using the Testpoint Window. The Testpoint Window is context-sensitive and displays the Test Domain for the selected element in either the Project Browser or diagram. Selecting a single Class will display the Class structure. A 'pencil' icon is displayed against Classes and methods that have existing constraints. When you select a Test Cut, Set or Suite Test, the Testpoint window displays the entire Domain structure including all the Classes that make up the domain. Note: You can navigate the domain hierarchy using the 'Navigation' pane on the right. Testpoints are composed as expressions using the variable names of the Class members. The intelli-sense shortcut is available within the editor to help you find these. Expressions that evaluate to True are taken to mean a pass. Returning False is taken to mean a fail.
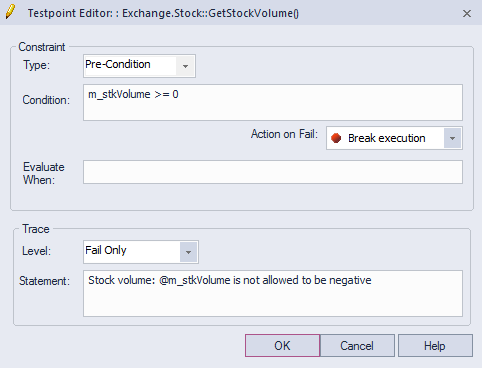
You can add or edit an existing Invariant by double-clicking the Class. You can add or edit an existing pre- or post-condition similarly by double-clicking the method. Double-clicking a Testpoint will automatically display the source code if it is available. Line conditions are best added from within the code editor using its shortcut menus. This image is of a pre-condition in the above Test domain.
|
The Testpoints Window Testpoint Editor |
|
Testpoint Trace Statements |
Each Testpoint can have its own Trace statement. The Trace statement is a dynamic message that can reference variables in its object or local scope. They are output during the evaluation of a test. They can be configured to be output every time a constraint is evaluated, or more usually when a test has failed. Trace statements can be directed to the 'Testpoints' tab of the System Output Window, or to an external file. You can configure this in any Analyzer Script. |
Specifying a Trace Statement The System Output Window Managing Analyzer Scripts |
|
Test Domain Composition |
The Test Domain diagram is a dynamic medium where Testpoints are assembled to test Use Cases. Use Cases in a Test Domain diagram are provided in three different stereotypes: Test Cut, Test Set and Test Suite. Management of the domain is as easy as modeling on any diagram. The toolbox and shortcut menus provide access to any Test Domain Artifacts. In brief, Testpoints from multiple Classes are aggregated into Test Sets. Test Sets are then linked to form Test Suites. Both Test Cuts and Test Sets are re-usable assets. Linking the same Test Set to the one or more Test Suites is a matter of drawing connectors.
|
Test Domain Toolbox Test Cut Test Set Test Suite Combine Testpoints |
|
Test Domain and the Class Model |
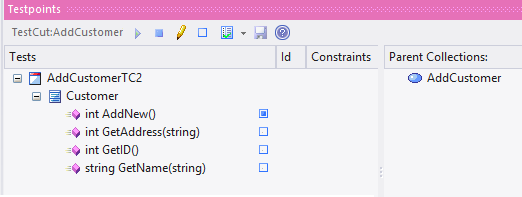
Rarely would a Use Case involve all the methods of a single Class. Most likely it is realized using a variety of methods from collaborating Classes. We call this subset of methods a cut and the Test Cut Artifact is the tool we use to make these cuts. The Testpoint Window will adapt depending on the context, be that a Test Domain or Class element. This image shows the Testpoint window when a Test Cut has been selected. Note the checkboxes. These are only visible for a Test Cut. They denote the methods (Test Cut) which are contributing to a Test Set. In this example the Test domain was generated by the Execution Analyzer, which did the method identification work for us.
|
|
|
Testpoint Evaluation |
The Testpoint window is used to evaluate Test domains. The window has a toolbar for starting or attaching to the target application. The domain to test is always reflected by the element that has context, so if you select a Class the window will show only the Class structure and Testpoints of that Class. If you select a Test Suite, the window will display the entire domain hierarchy and all the Testpoints included in it. Clicking on the will load the Testpoint domain in the Execution Analyzer, which will then evaluate, collect and update the report window as Use Cases pass or fail each test. The exact details of each constraint type and the when and how of that constraint's capture are:
|
Constraint Composition |