| Prev | Next |
Roadmap Diagrams
Roadmap diagrams help you to map existing elements against a Timeline. This is useful for visualizing how a system changes over time, planning a migration of responsibility between two teams, documenting the concurrent support for multiple platforms or representing just about any time based data. To ensure the modeler and viewer always have appropriate context, the Timeline is always displayed on screen, on any saved images and when printed.
Changes of phase or state of each element can be represented in Roadmap diagrams using a dedicated notation of a bar divided into colored segments representing each state. The states available, the order they appear in and the colors used are controlled by a Diagram Legend. Each element displayed then shows the length of each segment (and hence duration of each state), and also provides the ability to hide individual segments on that element.
Creating a Roadmap Diagram
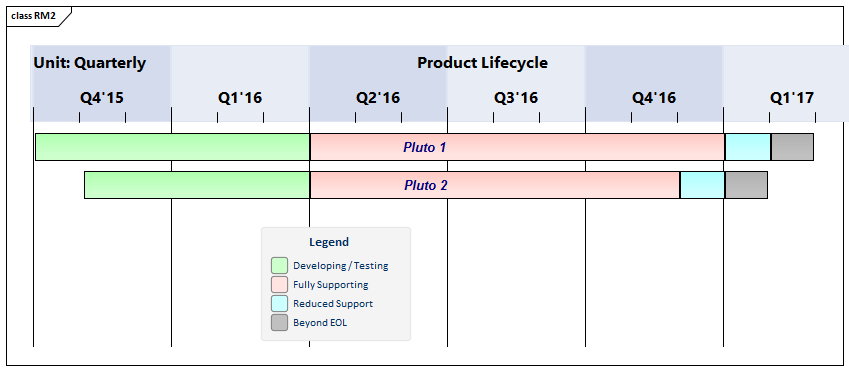
This diagram shows an example Roadmap that documents the planned lifecycle for two products through development, release, support and retirement, by quarter over a period of one and a half years.
You can develop this diagram as the example for the guided procedure in the 'Setting up a Roadmap Diagram' table. To create the initial, basic diagram:
- Right-click on its parent Package and select the 'Add Diagram' option.
- On the 'New Diagram' dialog, in the 'Diagram' field type in the diagram name, such as 'Example Roadmap'.
- Click on the 'Select From' header and select the 'Construction > Project Roadmap' Perspective group, and then click on 'Project Management' in the panel beneath the header.
- The 'Diagram Types' panel list two diagram types - Project Management and Roadmap. Click on the Roadmap diagram type.
- Click on the . The system opens the diagram in the central work area.
You can also generate one of over 20 pre-designed Roadmap diagrams from the Patterns provided by Enterprise Architect, to tailor the Roadmap for any of a range of areas of work. To access these Patterns, select the 'Design > Package > Insert > Insert Using Model Wizard' ribbon option , then select the 'Construction > Project Roadmap' Perspective. If necessary, expand these groups:
- Roadmaps - Strategic
- Roadmaps - Technology
- Roadmaps - Project
Select the required Roadmap(s) and click on the . Each Roadmap is automatically created within its own Package.
Access
On an open diagram, display the 'Roadmap Options' dialog using one of the methods described here.
|
Ribbon |
Design > Diagram > Edit > Roadmap |
|
Context Menu |
In a diagram, right-click on the background | Roadmap |
Setting up a Roadmap Diagram
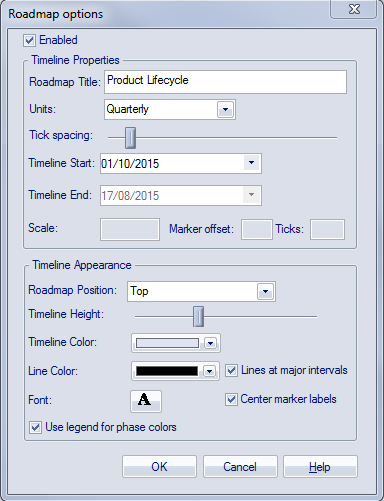
Starting with the 'Roadmap options' dialog, follow these steps to set up the Roadmap diagram. The fields are described in greater detail in the Roadmap Diagram Options topic. This procedure includes using a Diagram Legend to automatically divide an element into phase segments in different colors. The steps lead you to create the diagram shown at the start of this topic.
Step |
Action |
See also |
|---|---|---|
|
1 |
Select the 'Enabled' checkbox, to enable the timeline on the diagram. |
|
|
2 |
In the 'Roadmap Title' field, type a title for the diagram such as 'Product Lifecycle'. (The title is optional, and you can leave the field blank if you prefer.) |
|
|
3 |
In the 'Units' field, click on the drop-down arrow and select 'Quarterly'. The major sections are displayed in alternating light/dark shades to make it easy to distinguish between adjacent sections. The 'Units' field offers a wide range of pre-defined units for the scale of the Timeline, and you can define your own customized units. You can also change the section display color using the 'Timeline color' field in the 'Timeline Appearance' panel. |
Roadmap Diagram Options |
|
4 |
Click on the 'Tick Spacing' slider and drag it left or right to scale the timeline to a size that is appropriate for your diagram. |
|
|
5 |
In the 'Timeline Start' field, click on the drop-down arrow and click on the date on which the Roadmap Timeline is to start. (For the example, select October 1st 2016; the exact value doesn't matter, as long as it is within the quarter you want to start in.) The 'Timeline End' field is disabled for date unit scales (that is, years, quarterly, months and days). |
|
|
6 |
Adjust the appearance settings:
|
|
|
7 |
Click on the to save the settings and close the dialog. |
|
|
8 |
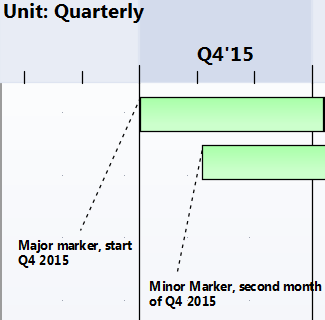
From the Diagram Toolbox drag two Class elements onto the diagram. Give them the names 'Pluto 1' and 'Pluto 2'. Move and resize 'Pluto 1' so that its left edge is on the Q4'15 major marker line (the start of October 2015), and its right edge is just under the second Q1'17 minor marker (the end of February 2017). Move and resize 'Pluto 2' so that its left edge is under the first Q4'15 minor marker (November 2015) and its right edge is under the first Q1'17 minor marker (the end of January 2017).
|
|
|
9 |
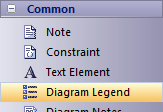
From the 'Common' page of the Diagram Toolbox, drag a 'Diagram Legend' icon onto the diagram.
You will use this to add and format the phase segments on the two elements. Double-click on the Diagram Legend to display its 'Properties' dialog, and define how the Legend element itself will be displayed and how the phase segments will be applied. In the example, you will define these four phases:
For each phase, type the name in the 'Value' field, select a display color in the 'Fill color' field and click on the to save the phase definition. Select the 'Apply auto color' and 'Apply Fill' checkboxes, and then click on the to save the settings and close the dialog. |
Legend Key Legend Properties Create Legends |
|
10 |
You now have two elements on the Timeline, each with four colored segments of equal length that represent the product lifecycle phases as indicated in the Diagram Legend. To set the duration of each phase, click on the dividing line between two phases and drag it to the appropriate point relative to the scale on the Timeline. You have now created a Roadmap diagram resembling the example shown at the start of this topic. |
Hide Segments
When you set up a Legend to apply segments to the elements on a Roadmap, every element on the Roadmap has all the defined segments. However, certain segments might not be relevant to particular elements, in which case you can hide those segments on those elements. Should a hidden segment become relevant to an element, you can show it again. When you hide and show segments, the segment lengths default to equal and you need to manually re-size the segments to the appropriate lengths.
To hide or redisplay segments on an element:
- Right-click on the element and select the 'Hide/Show Roadmap Segments' option. The 'Hide/Show Roadmap Segments' dialog displays, listing the segments defined in the Legend. Each segment has a checkbox.
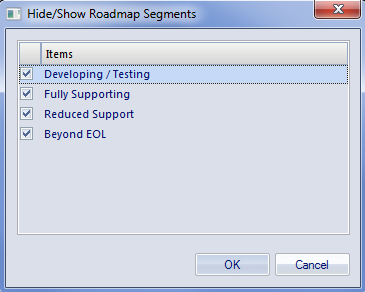
- For each segment to show on the element, select the checkbox. For each segment to hide on the element, deselect the checkbox.
- Click on the . The selected segments on the element display on the diagram; drag the segment ends to indicate the correct duration of each segment.
Notes
Learn more

