| Prev | Next |
Data Flow Diagrams
This text is derived from the Data Flow diagram entry in the online Wikipedia.
'A Data Flow diagram (DFD) is a graphical representation of the 'flow' of data through an information system. A Data Flow diagram can also be used for the visualization of data processing (structured design). It is common practice for a designer to draw a context-level DFD first which shows the interaction between the system and outside entities. This context-level DFD is then "exploded" to show more detail of the system being modeled.'
'Data Flow diagrams were invented by Larry Constantine ... based on Martin and Estrin's "data flow graph" model of computation. (They) are one of the three essential perspectives of Structured Systems Analysis and Design Method SSADM. The sponsor of a project and the end users will need to be briefed and consulted throughout all stages of a system's evolution. With a Data Flow diagram, users are able to visualize how the system will operate, what the system will accomplish, and how the system will be implemented. The old system's Data Flow diagrams can be drawn up and compared with the new system's Data Flow diagrams to draw comparisons to implement a more efficient system.'
'Developing a DFD helps in identifying the transaction data in the data model.'
Access
Use any of the methods outlined here to display the Diagram Toolbox, then click on  to display the 'Find Toolbox Item' dialog and specify 'Data Flow Diagrams'.
|
Ribbon |
Design > Diagram > Toolbox |
|
Keyboard Shortcuts |
|
|
Other |
Click the |
Disable Data Flow Diagrams
If you prefer to not use Data Flow diagramming in Enterprise Architect, you can disable it (and subsequently re-enable it) using the 'MDG Technologies' dialog (select the 'Specialize > Technologies > Manage' ribbon option).
Data Flow Diagrams in Enterprise Architect
Within Enterprise Architect, you can develop Data Flow diagrams quickly and simply through use of an MDG Technology integrated with the Enterprise Architect installer. The Data Flow diagram facilities are provided in the form of:
- A Data Flow diagram type, accessed through the 'New Diagram' dialog
- A 'Data Flow Diagram' page in the Diagram Toolbox
- Data Flow element and relationship entries in the Toolbox 'Shortcut Menu' and Quick Linker
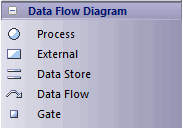
Data Flow Diagram Toolbox Page
Page Appearance |
Description |
See also |
|---|---|---|
|
Process is a process or activity in which data is used or generated. External represents an external source, user or repository of the data. Data Store represents an internal physical or electronic repository of data, into and out of which data is stored and retrieved. Data Flow (connector) represents how data flows through the system, in physical or electronic form. Gate represents the termination point of incoming and outgoing messages on a lower level diagram (that is, messages to and from processes depicted elsewhere). |
Data Flow Diagram Appearance
When dragged onto a Data Flow diagram, the elements and relationships have these appearances:
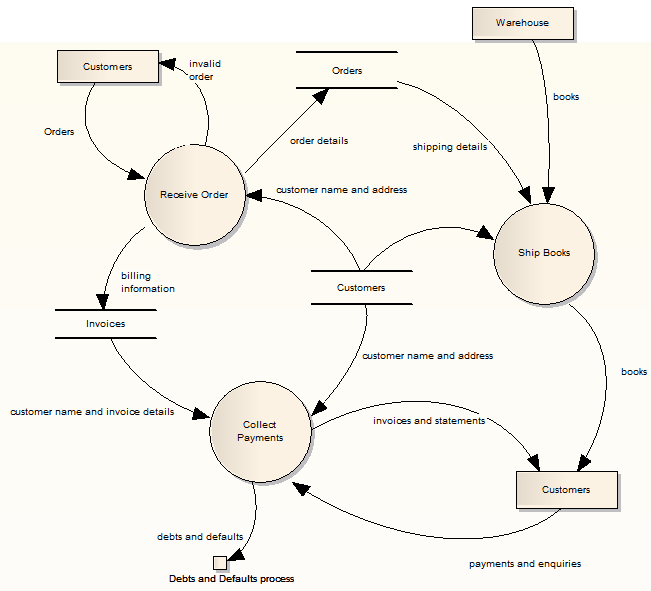
To preserve the simplicity and readability of the diagram, you cannot display element compartments on the diagram.
Context Diagram
A Context diagram is a top-level Data Flow diagram that has just one Process element representing the system being modeled, showing its relationship to external systems.
Learn more

