| Prev | Next |
Process Modeling
A process model can be used to model a wide range of sequential activities including business processes, system processes or even the flow through an algorithm in a programming module. Enterprise Architect supports a variety of ways to model processes including the Unified Modeling Language (UML) Activity diagrams, Business Process Model and Notation (BPMN) Business Process diagrams and Flow Charts as part of the Strategic Diagramming set. These can be drawn at any level and drill down functionality is provided allowing a modeler to click through from a high level diagram such as a value chain down to the task level representations. The process elements can be linked to a wide range of other elements including: Business Rules, Polices, Standard Operating Procedures and Use Cases or User Stories.
The tool supports both Current State and Future State modeling and transitions can be modeled showing the time sequence of changes between the current state and the future state. Enterprise Architect also has the ability to run model simulations from these models allowing powerful insights to be gained that will assist with improving efficiency and effectiveness.
Enterprise Architect supports a number of different languages and techniques for performing Process Modeling. The choice of language will depend on what has been defined as a standard by the organization or pragmatic considerations such as what the customer or subject matter experts will be most comfortable with.
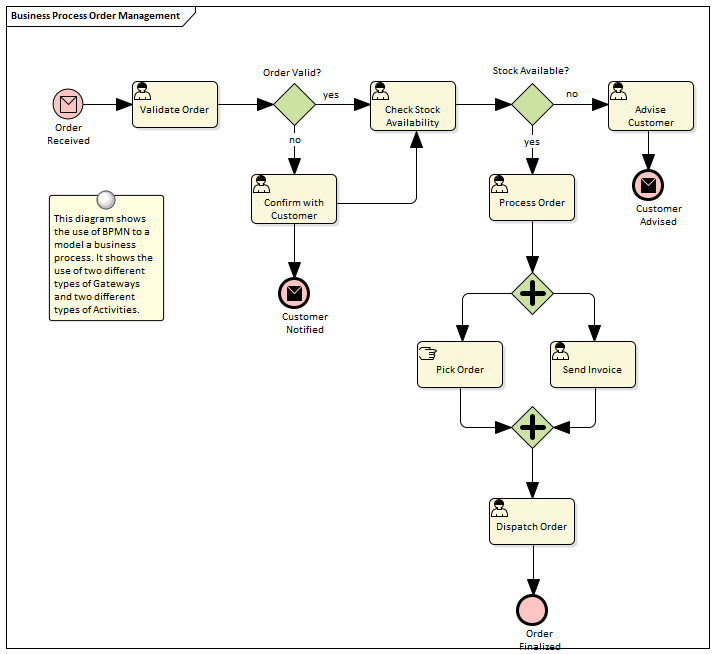
BPMN Business Process Diagram
Business Process diagrams are part of the Business Process Model and Notation (BPMN) standard and allow a modeler to document a business process, including the way the process starts, what work is performed and how it ends. Gateways and connecting lines determine the sequence of activities. Current state and Future state process models can be created and managed in Enterprise Architect. The diagrams can be organized into a process hierarchy allowing drill down from high level to lower level diagrams. BPMN is emerging as an important standard for modeling business processes and has gained much traction with business and technical communities. It can be automatically generated to the Business Process Execution Language (BPEL), which is an XML based language that can be ingested by a number of orchestration engines.
Learn More: Business Process Modeling
UML Activity Diagram
Activity diagrams are one of the Behavioral Unified Modeling Language diagrams and allow a modeler to describe the sequence of behaviors including how they start, what work is performed and decisions that change the flow and the way the process ends. They are a useful alternative to using other diagrams such as Flow Charts and Business Process diagrams. The syntax of Activity diagrams when Actions and Pins are used can be drawn at the execution level and to express detailed system semantics.
Learn More: Activity Diagram
Flowcharts
A flow chart can be used to represent a process, workflow or algorithm and is a general purpose diagram for representing a sequence of steps and decisions. Connecting lines determine the sequence of the steps in the flow chart. Flow charts are an easy to understand representation of the steps in a process. The syntax of the diagrams are much easier to understand than their more advanced cousins: the BPMN Business Process diagram and the UML Activity diagrams.
Learn More: Flow Chart Diagram
ArchiMate Process Diagram
Allows the high level description of a business process showing what triggers the process and the order of processes. If detailed representations are required BPMN Business Process diagrams or UML Activity diagrams should be used.
Learn More: ArchiMate Process Diagram
Data Flow Diagram
A Data Flow diagram provides a diagrammatic representation of the way data (information) flows through an information system. It shows where the data originates and where it is consumed and stored. These diagrams typically show the functions (or processes) that operate on the data but do not indicate timing or sequencing.
Learn More: Data Flow Diagrams
Business Rules Analysis
Business Rules are often associated with the Activities described in a process model and best practice suggests they should be managed separately from the Activities but they should be linked to the Activities they apply to.
Learn More: Business Rules Model
Organizational Chart Diagram
The activities (steps) in a business process are typically performed by a role in the organization (or by a system on behalf of a role). Thus an Organizational Chart will provide a useful source for these roles and will help the analyst to express the relationship between the steps in the process and the roles that perform them. It is also common for a business unit or stakeholder to be responsible for a process and these units or roles can be related to the Activities either using diagram relationships or Tagged Values.
Learn More: Organizational Chart Diagram
Baselines
The Baseline Tool is used as a type of comparison and backup and recovery tool. The tool can capture a snapshot of the Process Models at a point in time and then at a later time the repository can be compared to this (or another baseline) for the purpose of determining what has changed. It is possible to revert the current model to a state captured in the baseline at the level of a granular change. This is a useful tool when working with Processes or any other model that typically has sign off milestones. Baselines are typically taken at important milestones and given a memorable name such as 'After Stakeholder Final Workshop'. Baselines can be applied at the Package level and can be applied regardless of what type of elements are contained in the Package.
Learn More: Baseline Tool
Visual Filters
Visual Filters can be used to hide or dim parts of the diagram so that other parts can be emphasized. This is particularly useful when presenting a Business Process diagram to a team in a meeting or demonstration. Context Filtering is easy to set up and will emphasize the currently selected diagram element and its directly connected elements.
Learn More: Visual Filters

