| Prev | Next |
Data Flow Diagrams
These diagrams show how data flows through an information system, which processes or external entities create or consume the data, and where it is stored. They do not detail the sequencing between processes, which would be represented by process models. Enterprise Architect provides a Data Flow diagram that modelers can use to create expressive diagrams with click-through drill-down from the Concept diagram right through to the lowest level diagram.
This section lists the main tools available in Enterprise Architect that can be used to perform this business analysis technique. There is also a wide range of additional tools that a modeler might find suitable when applying the technique in a particular context. The complete list of tools is available from the Business Modeling Tools Help topic.
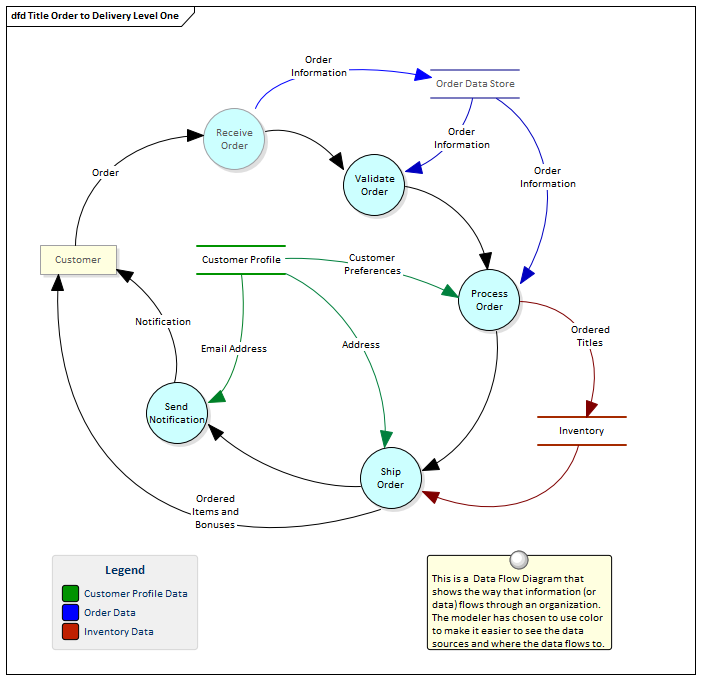
Data Flow Diagram
The Data Flow diagram (DFD) is part of the Structured Systems Analysis and Design Method and is used to show the way that data flows through a system including the Processes, Data Stores and Entities that relate to the data.
Learn More: Data Flow Diagram

