| Prev | Next |
Functional Decomposition
Enterprise Architect has been built as a platform for managing models of complex systems including business, information and technology systems. The tool allows business concepts such as outcomes, capabilities and processes to be decomposed. Information models can be broken down from high level concepts to details and technology models of components and devices can also be decomposed. There are a wide range of tools for working with and representing these models starting with the Project Browser that displays elements in a hierarchy allowing the user to expand or collapse levels thus revealing or hiding detail. Decomposition can also be represented in diagrams using elements such as the Aggregation connector on a single diagram or the ability to drill down through a whole chain of connected diagrams from a high level element in a value chain down to the low level processes.
Component Diagram
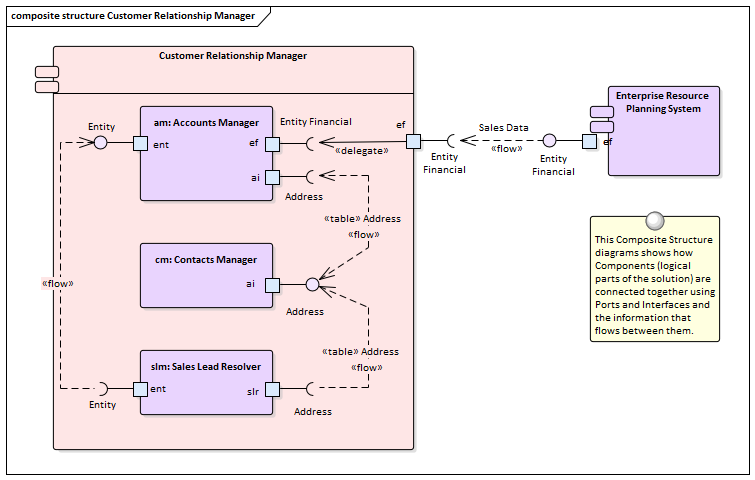
The composition of a system can be shown using a Component diagram where systems are displayed in a hierarchy including drill down to other Component diagrams. This allows a complex system that is made up of a number of subsystems to be modeled.
Learn More: Component Diagram
Organizational Chart Diagram
The Organizational Chart Diagram is part of the Strategic Modeling group of diagrams and shows the structure of an organization including officials, roles responsibilities, business units or departments. The roles or departments can be displayed in a diagram using a tree layout or in a list view. Any number of Tagged Values can be added to the elements or connectors to add additional information as required. The diagram can be used to show the decomposition of an organization by roles or business units.
Learn More: Organizational Chart Diagram
Project Browser
Functional Decomposition can be achieved by creating a feature hierarchy using the Project Browser without the need to create a diagram. A system Feature is a good way to capture the high level capabilities of a system and these can be created directly in the Project Browser. Additional features can be added under each first level feature creating a second level of features. These second level features can have features nested under them creating a third level. The resulting tree of Features provides a useful way of describing Functional Decomposition that can be presented to and reviewed by stakeholders.
Learn More: Project Browser
Requirements Diagram
Functional Decomposition can be achieved by using a Requirements diagram to create a hierarchy of system features. A system Feature is a good way to capture the high level capabilities of a system, and these can be broken down to a number of levels using a tree structure created with an Aggregation or Composition Relationship. This provides a compelling representation of scope that can be reviewed by the stakeholders and used as a guide through the initiative. Gaps and out-of-scope features should be identified as early as possible and the tree amended to reflect these. Out of Scope features could be left as part of the tree but annotated in some way to indicate that they are out of scope such as by using a stereotype or by using color with a Diagram Legend.
Learn More: Requirements Diagram
BPMN Business Process Diagram
The BPMN Business Process diagram is useful for modeling business processes that form part of a process hierarchy. Enterprise Architect allows the modeler to define a decomposition of processes that can be drilled down to from a higher level. It allows a modeler to document the business process including the way a process starts, what work is performed and how it ends. Gateways and connecting lines determine the sequence of activities. The Business Process diagram is emerging as an important standard for modeling business processes.
Learn More: Business Process Diagram
Specification Manager
The Specification Manager is the primary tool for working with text based elements such as Features, Requirements and Components. These and other elements can be created directly in the Specification Manager and their name and descriptive text can be added in a compelling Word Processor or Spreadsheet like format. Other built-in properties such as status, version and phase can be managed directly in the columns of the Specification Manager and where property lists are available these can be chosen or changed from drop down lists. Additional properties in the form of Tagged Values can also be managed from within the Specification Manager. The Specification Manager will reflect the hierarchical structure of elements and can use level numbering if this has been turned on.
Learn More: Specification Manager
UML Activity Diagram
The Activity diagram, which is part of the Unified Modeling Language, is a useful alternative to other diagrams such as Flow Charts and Business Process diagrams. They allow a modeler to describe the sequence of behaviors including how they start, what work is performed and decisions that change the flow and the way the process ends.
Learn More: Activity Diagram
ArchiMate Business Process Diagram
Allows the high level description of a business process showing what triggers the process and the order of processes. If detailed representations are required BPMN Business Process diagrams or UML Activity diagrams can be used.
Learn More: ArchiMate Process Diagram

