| Prev | Next |
Simulation Windows
When executing a Simulation in Enterprise Architect it is possible to set break-points, fire triggers, examine variables, record a trace of execution, set simulation speed, view the call stack and visually trace the active nodes as the simulation proceeds.
When a Simulation runs, some aspects such as the output and console input are found in the Simulator window itself, while others such as the local variables and call-stack use the standard Execution Analyzer windows. The table provides an overview of the main Windows used during Simulation.
Access
|
Ribbon |
Simulate > Dynamic Simulation > Simulator > Open Simulation Window |
Windows
Window |
Purpose |
See also |
|---|---|---|
|
Execution and Console |
The Simulation window provides the main interface for starting, stopping and stepping your Simulation. During execution it displays output relating to the currently executing step and other important information. See the Run Model Simulation topic for more information on the toolbar commands. Note the text entry box just underneath the toolbar. This is the Console input area - here you can type simple javascript commands such as: this.count = 4; to dynamically change a Simulation variable named "count" to 4. In this way you can dynamically influence simulation at run-time.
|
Run Model Simulation |
|
Breakpoints & Events Window |
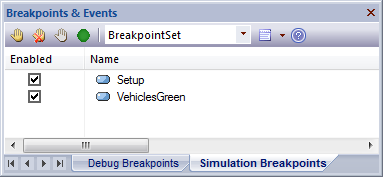
The Simulation process also makes use of the 'Simulation Breakpoints' tab of the Breakpoints & Markers window ('Simulate > Dynamic Simulation > Breakpoints'). Here you set execution breakpoints on specific elements and messages in a Simulation. See the Simulation Breakpoints topic for more details.
|
Simulation Breakpoints |
|
Simulation Events Window |
The Simulation Events window ('Simulate > Dynamic Simulation > Triggers') provides tools to manage and execute triggers. Triggers are used to control the execution of StateMachine transitions.
|
Simulation Events Window Triggers Waiting Triggers |
|
Call Stack Window |
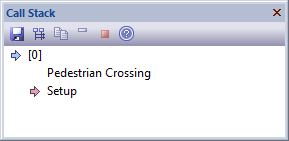
During the Simulation the Call Stack window ('Simulate > Dynamic Simulation > Call Stack') displays information about the Threads and current execution context of the Simulation. The Simulator supports multi-threaded Simulations and will include a Thread entry for every active and paused thread of execution. For each thread, the Call Stack window will show the start or entry context (such as a StateMachine element) plus the current active element within that thread. If the current active element is the entry point of a composite activity or sub-machine state, the stack will also include the current active element within that sub-context (and all further nested, active composite, sub-states as well).
|
View the Call Stack |
|
Simulation Local Variable Window |
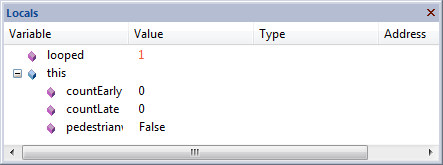
The Simulator uses the standard Locals window ('Simulate > Dynamic Simulation > Local Variables') to show all current Simulation variables when the simulation is single stepping or paused at a break point . Note that it is possible to dynamically update these variables using the Simulator Console described above.
|
View the Local Variables |
|
Recording |
During execution of your Simulation, a recording is kept of all activity and displayed in the Record & Analyze window ('Execute > Analyze > Recorder > Open Recorder'). This is similar to how the normal call recording works in the Visual Execution analyzer - although at this time, no ability to generate Sequence diagrams from recordings is possible.
|
The Recording History |


