| Prev | Next |
Create Sections as Tables
In a document report template, you can render a model section as a table, defined with any number of columns but with only two rows:
- The first row is used to describe the headings of the columns, which you define and format yourself
- The second row defines the output, which you specify by right-clicking in each cell and selecting the output type from the field list; the output is then generated iteratively for every occurrence of the section in question
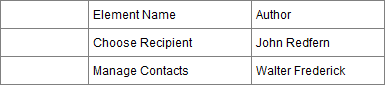
For example, you might set up the Model > Glossary > section as a section table, using the table definition:
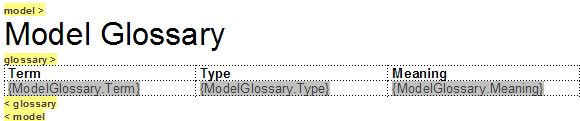
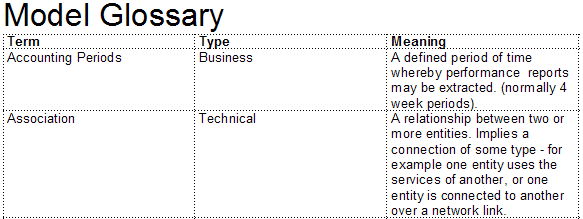
This table definition renders the document output:
Access
|
Ribbon |
Document-Edit > Paragraph > Table > Insert Table |
Create and format a table
To |
Action |
See also |
|---|---|---|
|
Insert a table in the document |
Position the cursor on the point in the text to create the table, and from the 'Document-Edit' ribbon bar select 'Paragraph > Table > Insert Table'. The 'New Table' dialog displays, in which you specify the number of table rows and columns. For a model section table in a report template you can accept the default values of two rows and three columns. Click on the . Your table might be invisible; if so, select the 'Paragraph > Table > Show Gridlines' from the ribbon bar to reveal the table and cell borders in dotted lines. These lines are for guidance in creating the document, and do not display on the printed document. You can add printable borders if you prefer, using other menu options. The editor initially creates a table with cells of equal width across the page; you can change the cell width by dragging the cell borders using the mouse, or using other context menu options. |
Create Tables |
|
Add a header row |
Select the top row of the table, and then select 'Paragraph > Table > Header Row' from the ribbon bar. Apply any heading text, settings and formatting to the highlighted row. In the document or compiled report, the heading row is repeated at the top of the columns each time the table flows on to a new page. In a report, if the heading row is populated with the values from field names, the heading rows on subsequent pages reflect the values from that first row. This option operates on the single row at the top of the table, and not on multiple rows. |
|
|
Populate data row with fields |
Right-click on the table cell and select the 'Insert Field | <field name>' option to add one or more fields to the cell. When the report is generated, the field values are extracted and displayed in the table for each instance of the object, such as an element or attribute. |
Notes
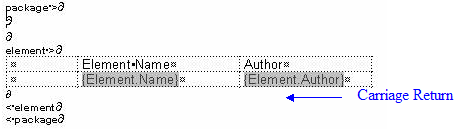
This generates the table:
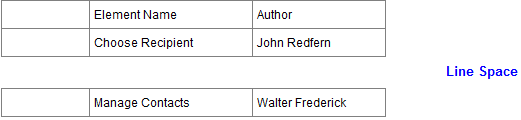
To avoid this, remove any carriage return between the end of the table and the section terminator, as shown:
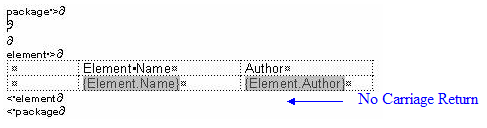
This generates a table with no space between the rows: