| Prev | Next |
Views and Viewpoints
Views and Viewpoints are closely related to the notion of communicating with stakeholders, who commonly have different needs when it comes to understanding the architectures and the way they describe the things of interest to them.
There is theoretically an infinite number of viewpoints and views but in practice it turns out that many groups of stakeholders will benefit from a common set of views and viewpoints. It should be remembered that many stakeholders perform a number of roles and so an individual’s needs might be satisfied by a number of different views from different viewpoints. The view is what can be seen from a viewpoint but it can have different representations depending upon what the stakeholders want to see, including level of detail, fidelity, filtering, stylizations and more. So a Chief Information Officer (CIO) and a Development Manager might want to view the applications that realize a given business capability in the current state architecture, but the CIO will want a simple list or diagram. The Development Manager on the other hand might want a detailed diagram of the same applications, showing interfaces and payload information. A number of methods and languages promote the idea of a Viewpoint Library consisting of a series of useful and commonly used viewpoints.
Enterprise Architect has a wide range of tools to assist with the creation and management of viewpoints, views and representations. There are several tools that can be used to create different views of the elements in the repository; these include the Working Sets and the Model Views. Working sets allow a collection of diagrams, Matrixes, Team Libraries and other items to be saved and reopened as a set, which is useful when working with different groups of stakeholders. Model Views can be used to create views of elements grouped together irrespective of their location in the Project Browser. There are several tools that can hide or obscure parts of a diagram to make it more appealing to a particular audience. The appearance of diagrams can be altered by changing the appearance of elements, including using an image, and Diagram Filters can obscure or hide elements from view. A powerful Documentation engine can create high quality publications directly from the model.
This section lists the main tools available in Enterprise Architect that can be used to provide Views and Viewpoints. There is also a wide range of additional tools that a modeler might find suitable when applying the technique in a particular context. The complete list of tools is available from the topics Meet the Enterprise Architecture Tools and Additional Enterprise Architecture Tools.
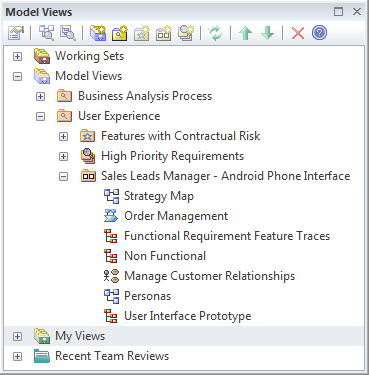
Model Views
Model Views is a facility that allows a modeler to create lists of elements in alternative views to the way they are organized in the Project Browser. It is a useful facility for creating views of elements and diagrams that can be saved as a set, viewed as a slide show or dynamically created using a search. Any number of Favorite folders can be created and grouped into one or more higher level folders. This provides a mechanism for manually defining a view by simply dragging elements or diagrams from the Project Browser into the Favorites folder, and ordering them using the up arrow key and down arrow key in the toolbar. Alternatively, elements can be listed using a built-in or user defined search to select elements from anywhere in the repository based on properties such as Complexity, Version and Phase, or user defined properties defined in Tagged Values. You can also set up a Slide Show folder where any number of diagrams can be added to a slide show. This is a useful tool for presenting prototypes, particularly when there are a number of diagrams that describe the user interface in different states, such as how the interface responds to a button click. Views can be saved as slide shows that can be configured to run automatically with a specified time interval, or slide progression can be controlled manually.
Learn More: Model Views
Relationship Matrix
The Relationship Matrix can be used to present the relationship between two sets of elements in a matrix style of view. The matrix provides a compelling view of the relationships between the elements allowing stakeholders, analysts and architects to quickly locate missing or overlapping relationships. The matrix can be augmented with overlays that can be used to present specific values in the intersecting cells to indicate the nature of the relationship.
Learn More: Relationship Matrix
Specification Manager
The Specification Manager is a powerful tool for creating a view of elements contained in a Package or element hierarchy in the repository. It is particularly useful for presenting lists or catalogs of parts of the architecture to non-technical stakeholders. It has the appearance of a simple document editor or spreadsheet and there is a range of options to change the presentation to make it more appealing for different audiences.
Learn More: Specification Manager
Working Sets
Working sets are a useful facility for working with views and viewpoints, as they allow a series of views to be collected as a set, given a name, saved and reopened at a later time. They are useful for working with stakeholders who might be interested in a particular set of views. The set can include diagrams, Matrix Profiles, Team Libraries and more, and any number of working sets can be created.
Learn More: Working Sets
Roadmap Diagrams
The Roadmap is an overlay that can be applied to any diagram and can be conveniently enabled or disabled. The overlay presents a timeline that is used to indicate the starting time, duration and finishing time of important phases in the lifetime of the elements on the diagram. It is particularly useful for describing transitions between a baseline and a target or transition architecture. Any diagram object can appear on a Roadmap diagram, including Business Capabilities and Capability Increments, Applications and Services, and Physical or Virtual servers described in a Technology Architecture. The appearance and properties of the timeline can be altered to set the Units, Tick Spacing (Year, Months, Days), Start and Finish time, Colors, Fonts and more. The phases on the elements can be configured in a Diagram Legend, allowing names and colors to be defined.
Learn More: Roadmap Diagram
Documentation
Enterprise Architect has a powerful and flexible documentation generator that can produce Docx and RTF Word Processor files, PDF and HTML reports. Any number of views of the repository content can be created by generating documentation and the powerful Virtual Documents facility allows content to be cherry picked from anywhere in the repository and grouped into sections presented with common template. The formatting in element or diagram notes can also be carried through to the documentation. A sophisticated template facility exists that provides a range of built-in templates and also allows the user to create their own templates, defining styles, cover pages, tables of contents, images and a wide range of other formatting options.
Learn More: Documentation
Element Appearance
Many of the stakeholders will be managers or non technical staff who will benefit from viewing diagrams with graphics. Images from the standard Image Library could be used or an organization is free to create their own graphics to represent concepts in the domain of the architecture or that have particular meaning to individuals or groups of stakeholders.
See also: Element Appearance
Visual Filters
Visual Filters can be used to obscure or hide elements on the diagram based on user-defined criteria. This is particularly useful as the same diagram can be presented in different views and used to communicate ideas to a wide range of stakeholders. Any number of filters can be created and used to focus attention on a particular part of the diagram, for example to show only applications or capabilities that are being implemented in a particular phase of the architecture or that have a specified status or both. The filters can be saved and reapplied to the same or any other diagram in the repository.
Learn More: Visual Filters
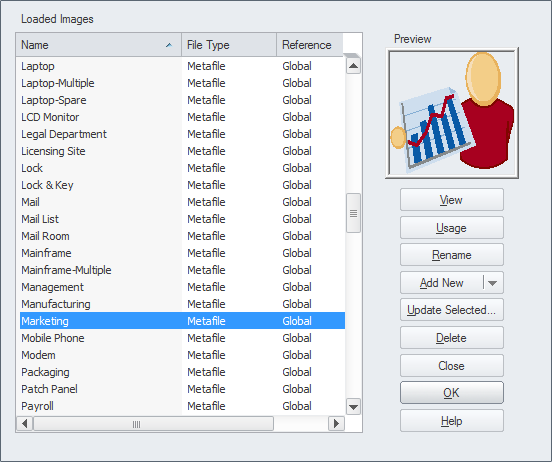
Image Manager
The Image Library is a global store of images in the repository that can be applied to any number of diagram elements. The images can be in a variety of formats and when used to change the appearance of an element they create a compelling diagram that is often more appealing to managers or non-technical audiences. Where possible it is recommended to store a vector based image so that it can be effectively scaled in a diagram. The images can also be used when defining the metafile for a stereotype.
Learn More: Image Manager