| Prev | Next |
Help Desk Phone Support Simulation - Resource Perspective
In this example, we create a very simple model to simulate a Help Desk phone support process.
We set up a scenario in which resources are limited and the requests have to be put in a waiting queue for a resource. Then we try to seek a balance point between customer's waiting time and the number of resources, using a what-if analysis.
Firstly, we model this process step-by-step, starting with a simple parameter setting than can be calculated with pen and paper, then verifying it with EABPSim. After that, we perform a what-if analysis that might help the manager to make a decision.
Create BPMN Model
The model itself is very simple, consisting of a Start Event, a Task and an End Event.
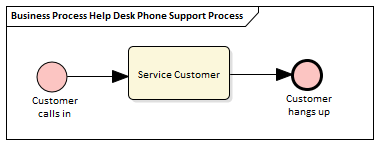
- Create a Start Event called Customer calls in
- Add a Sequence Flow to a target Abstract Task called Service Customer
- Add a Sequence Flow to a target End Event called Customer hangs up
Create a BPMN2.0 Resource named Support; this element will be used in the BPSim Configuration.
Pen and Paper Analysis
We will use pen and paper to analyze this case:
- 7 customers call in at 2 minute intervals
- 2 support resources are available
- Each service will take 10 minutes
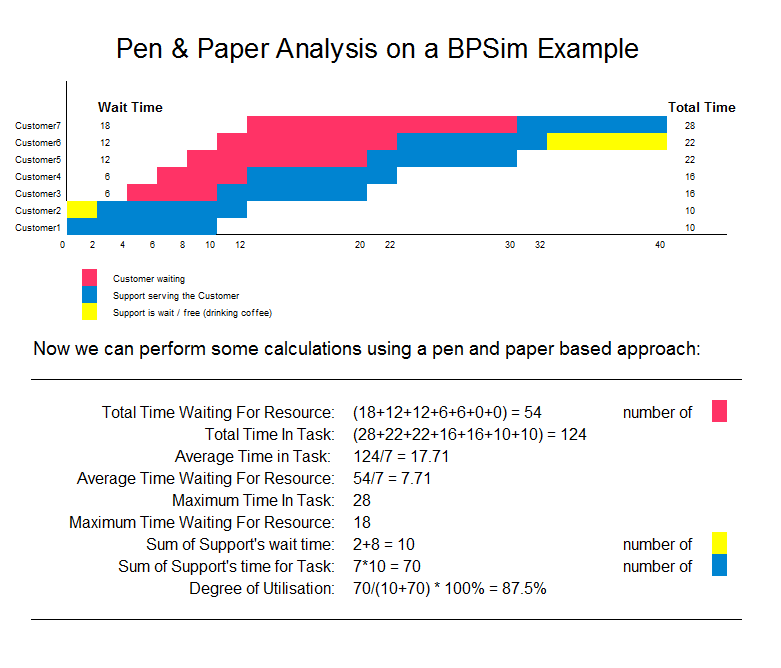
Seen from this result, it is already a very complicated computation for such a simple model when resource constraints are applied. When the process expands and more constraints are applied, analyzing the process with pen and paper will quickly become impossible. We will demonstrate how EABPSim can help.
BPSim Configuration
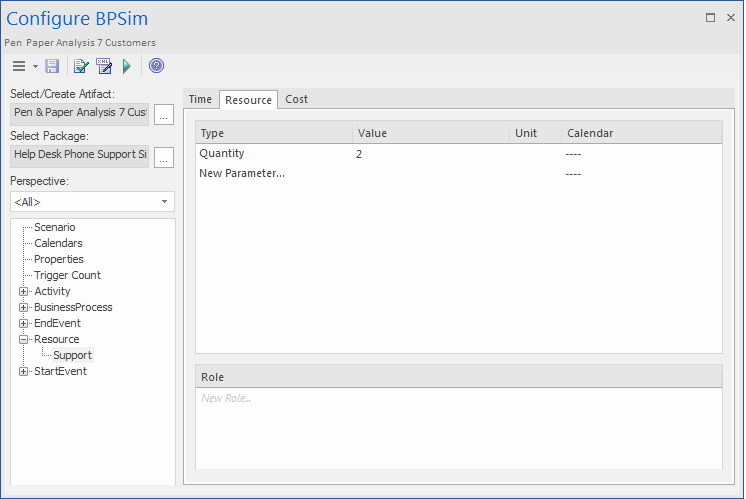
All the BPMN elements will be loaded in to the Configure BPSim window.
- In the left-hand tree on the window, expand the 'Resource' group and click on Support; click on the 'Resource' tab and on the drop-down arrow of the 'New Parameter' field, then select 'Quantity' and, in the 'Value' field, type '2'
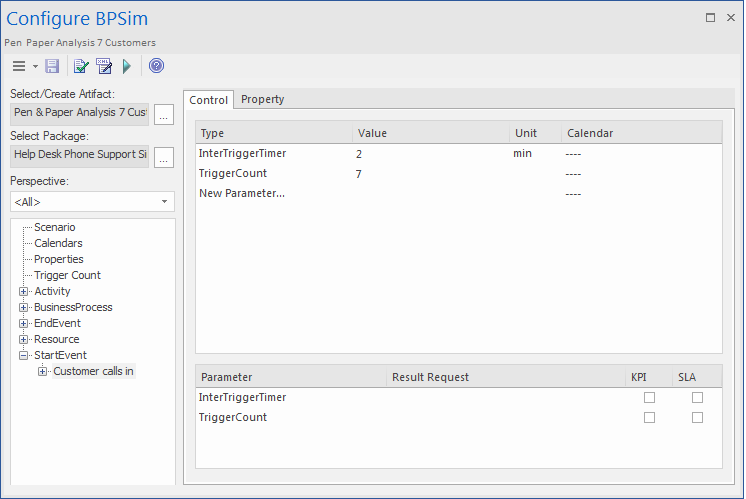
- In the left-hand tree, expand the 'StartEvent' group, then click on Customer calls in and on the 'Control' tab
- Click on the drop-down arrow of the 'New Parameter' field and select, in turn:
- 'InterTriggerTimer' and, in the 'Value' field, click on the button, select the 'Constant' tab
and 'Numeric', type '2' in the 'Constant Numeric' field and select 'minutes' in the 'TimeUnit' field
- 'TriggerCount', and in the 'Value' field type '7'
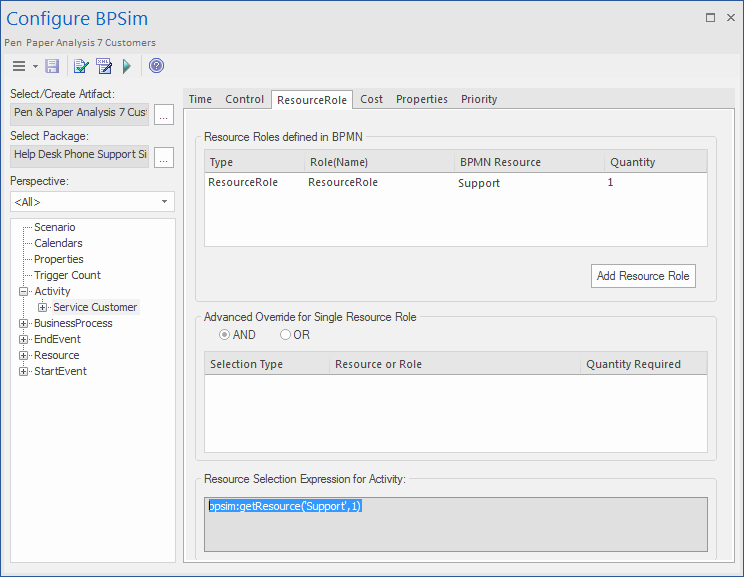
- In the left-hand tree, expand the 'Activity' group, then click on Service Customer and on the 'Time' tab
- Click on the drop-down arrow of the 'New Parameter' field and select 'ProcessingTime' and, in the 'Value' field, click on the button and select the 'Constant' tab and 'Numeric', type '10' in the 'Constant Numeric' field and select 'minutes' in the 'TimeUnit' field
- Click on the 'ResourceRole' tab, click on the ; in the new row in the 'Resource Roles defined in BPMN' panel, click on the button in the 'BPMN Resource' field and select the Support element you created earlier
- In the 'Quantity' field, type '1'
In the 'Resource Selection Expression for Activity' panel the automatically generated expression bpsim:getResource('Support',1) displays.
Run the Simulation
- On the Configure BPSim window Toolbar, click on the ; the 'BPSim Simulation Controller' dialog displays
- Click on the Run button drop-down arrow and select 'Standard Simulation'
- When the simulation is complete, click on the
 button on the 'BPSim Simulation Controller' dialog toolbar to open the 'BPMN Simulation Report View'
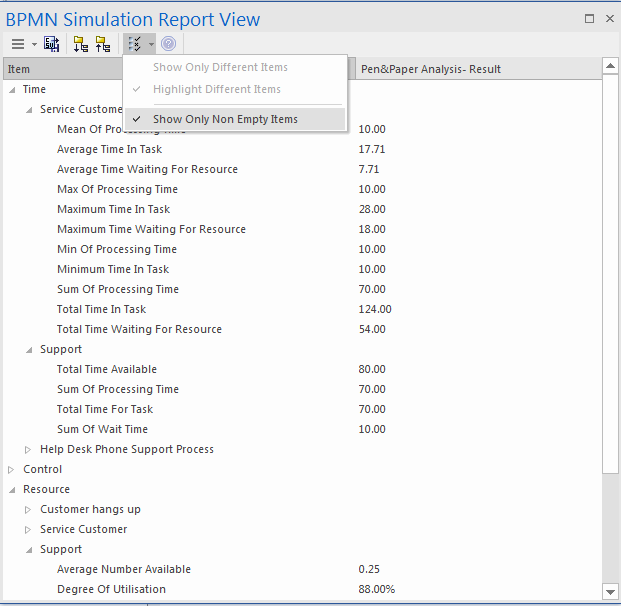
Tip: You can select the 'Show Only Non-Empty Items' option to filter the results.
The results match the pen and paper analysis.
Simulation - 2 Support Resources for 20 customers
You can create a new Business Process Simulation Artifact by copying an existing BPSim Configuration. Copy the Pen & Paper Analysis 7 customers element and press to paste, giving the new element the name TwoSupport.
- Double-click on TwoSupport to open the 'Configure BPSim' dialog; you can see that all the configurations are kept from the copied source
- Expand the 'StartEvent' group and click on Customer calls in; click on the 'Control' tab and, in the 'Value' field for the 'TriggerCount' parameter, change the figure to '20'
Run simulation and analyze results
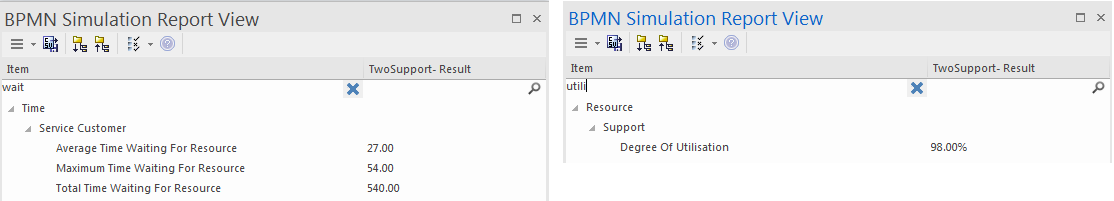
From the report, you can see that:
- The 'Average Time Waiting For Resource' is 27 minutes and the 'Maximum Time Waiting For Resource' is 54 minutes
- The two Support resources - are they busy? If they were not, we might have to change the process to use all of their time and reduce the customer's waiting time; however, the 'Degree Of Utilisation' is at 98%, which indicates that the resources had almost no idle time
'What-If' I have more staff? Compare 2 Support Resources with 3 and 5 Support Resources
- Copy TwoSupport and press Ctrl+Shift+V to paste, giving the new element the name FiveSupport
- Double-click on FiveSupport to open the 'Configure BPSim' dialog, expand the 'Resource' group and click on Support, then click on the 'Resource' tab and, for the 'Quantity' parameter, change the 'Value' field to '5'
- Run the simulations and do a comparison; in the Project Browser:
- on TwoSupport, ThreeSupport and FiveSupport, then right-click and select the 'Show
BPSim Configuration' option
- Ctrl+click on TwoSupport-Result, ThreeSupport-Result and FiveSupport-Result, then right-click
and select the 'Show BPSim Report' option
Tips:
- Use the
 button and click on the 'Show only different items' option for both views
 - You can dock the views together, so they provide direct comparisons: THESE are the differences in results caused by THOSE differences in configuration
- Toggle the filter bar to filter the items that interest you
Analysis
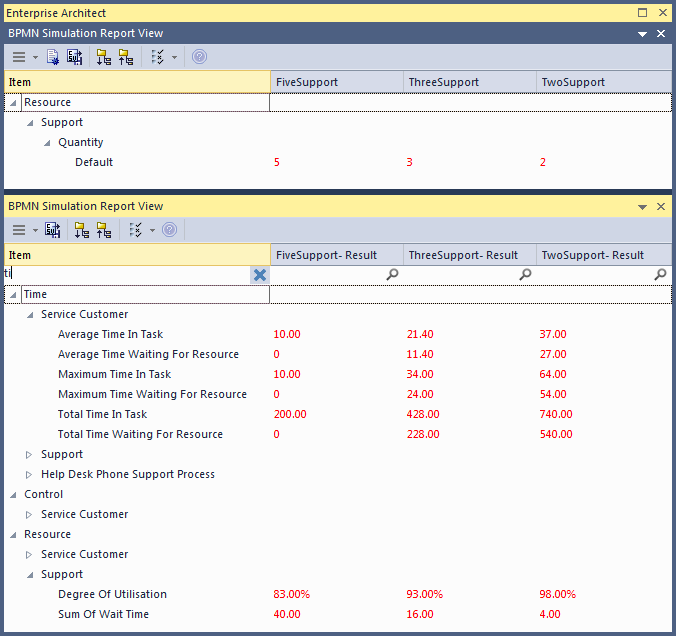
The docked comparison views show the configuration differences and the corresponding result differences.
- The customer's waiting time dropped from 27 minutes (2 Support resources) to 11.4 minutes (3 Support resources) and further down to 0 minutes (5 Support resources)
- The 'Degree Of Utilisation' dropped from 98% (2 Support resources) to 93% (3 Support resources) and further down to 83% (5 Support resources)
The customers will most likely be satisfied with 5 Support resources; however, the cost might be out of budget. So 3 or possibly 4 Support resources might be a balance point for this case. You are recommended to copy one of the Business Process Simulation Artifacts and configure and run a simulation for 4 Support resources.
Show Result with Chart
button and select a Base Report from which to define the schema (legends) to use in the chart; select TwoSupport-Result

- Create another BPSim Result Chart Artifact on the diagram, called Utilisation Rate
- Double-click on the Artifact to display the element 'Properties' dialog and click on the 'BPSim Chart' tab
- Click on the button and select a Base Report from which to define the schema (legends) to use in the chart; select TwoSupport-Result
- Choose the schema 'Resource' | 'Support' | 'Degree Of Utilisation'
- Click on the Add button to add another two BPSim Reports: ThreeSupport-Result and FiveSupport-Result
- Click on the OK button and adjust the size of the chart element


