| Prev | Next |
Business Capability Analysis
Capabilities can be modeled in Enterprise Architect as part of the tool's support for Business Architecture. The capabilities can be modeled to determine how well the organization is performing in its achievement of business goals or objectives. The Relationship Matrix can be used to provide a clear view of how the capabilities are meeting current and future goals and objectives.
This section lists the main tools available in Enterprise Architect that can be used to perform this business analysis technique. There is also a wide range of additional tools that a modeler might find suitable when applying the technique in a particular context. The complete list of tools is available from the topic Business Modeling Tools.
Relationship Matrix
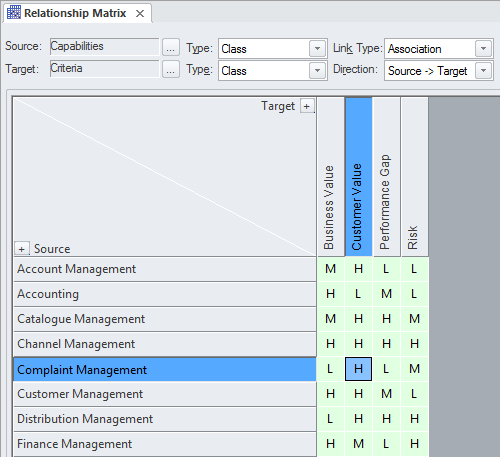
The Relationship Matrix is a powerful and compelling tool for visualizing the relationships between two sets of elements. Business Capabilities can be related to a number of different sets of elements including Use Cases, User Stories, Functional Requirements and Business Processes. A number of different Matrices could be created with the Business Capabilities on one axis and a different set of elements on the other axis in each of the matrices. The Matrices can conveniently be saved as resources and also exported to a Spreadsheet file. Overlays can be added to the matrix cells expressing things like the degree of compliance, effectively adding another dimension to the matrix.
Learn More: Relationship Matrix
Roadmap Diagram
A Roadmap diagram can be used to show how Capabilities change over time and to represent phases in the lifecycle of the Capabilities. The diagram has a Legend that is integrated with the elements on the diagram and can be used to express concepts such as Capability Definition, Acquisition, Support and Retirement. Colors can be assigned to the dimensions defined in the Legend and the time scale of the diagrams can be configured to suit the temporal scale of the Capability model.
Learn More: Roadmap Diagram
Class Diagram
Capabilities can be modeled using a stereotyped UML Class element. Stereotyping is one of the extension mechanism available as part of the UML; it allows a type to be created that represents a Business Capability. These can be added to a Class Diagram and connected by aggregation relationships to show a tree of Capabilities down to any level. The Capabilities can also have connections to a number of other elements including Goals, Objectives, Applications and more.
Learn More: Class Diagram
Project Browser
A Business Capability Hierarchy can be created directly in the Project Browser without the need to create a diagram. A UML Class is a good way to capture the Business Capabilities of an organization and these can be created directly in the Project Browser. Additional Capabilities can be added under each first level Capability creating a second level. These second level Capabilities can have Capabilities nested under them creating a third level. The resulting tree of Capabilities provides a useful way of describing Functional Decomposition that can be presented to and reviewed by stakeholders.
Learn More: Project Browser
Stereotyping
A Business Capability is not defined as an element type in any of the built-in Toolbox palettes but can be created as a type using the Unified Modeling Language (UML) extension mechanism of Stereotype. The defined Stereotype can then be applied to a Class to create any number of Capabilities that can be added to the model.
Learn More: Stereotyping
Visual Filters
Visual Filters can be used to hide or dim parts of the diagram so that other parts can be emphasized. This is particularly useful when presenting a Capability Model Class diagram to a team in a meeting or demonstration. Context Filtering is easy to set up and will emphasize the currently selected diagram element and its directly connected elements.
Learn More: Visual Filters

