| Prev | Next |
Lists Diagrams and Matrices
Lists, Diagrams and Matrices are the three main ways of presenting architectural information to stakeholders. These three representations can be used in isolation or together to provide a rich communication of the architectures; they can also be tailored to suit individuals or groups of stakeholders. They are often combined in repeatable sets called Views that provide consistent, coherent and relevant information to an audience.
Lists provide a simple catalog of items that can be displayed in a tabular format, where relevant properties and metadata can be viewed for each item and compared between items. Diagrams are a graphical projection of items connected as a graph and provide a compelling visual representation of the elements and their relationships. Matrices are grids that show the relationship between two sets of items from a particular point of view; they are a powerful visual device because they allow gaps and overlaps to be identified easily.
Enterprise Architect has a wide range of tools that support all three of these representations, with many extended features such as searching, sorting, layout, filtering, alternative images and simulations that allow an architect to create visually compelling representations of the architectural content.
Lists
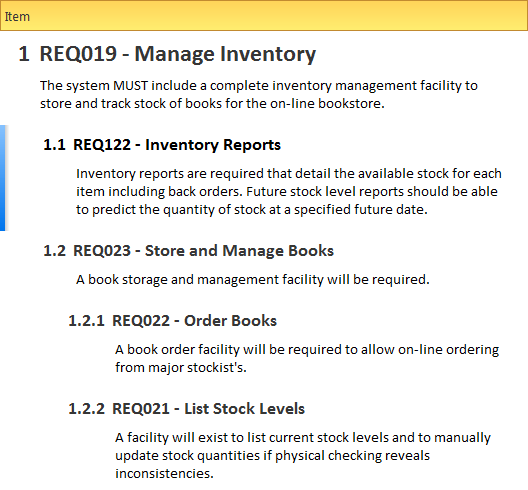
Enterprise Architect has a number of tools for working with elements in a list. These tools can be applied to any type of element including Principles, Business Drivers, Requirements, Applications, Interfaces, Technology Devices and more. The Specification Manager is a powerful tool that can be used to create and view any type of element in a visually appealing word processor-type or spreadsheet-type format. The properties of the listed elements can be displayed and any number of properties can be added or removed from the display, including Tagged Values. The properties can be edited for each row of the list, including selecting values from drop-down lists such as selecting a status. Filters appear below the header of each column and can be applied to restrict the display to elements that meet a particular condition. Changing any of the details of an element, including its name and description, will change it in every other part of the repository including the Project Browser and all diagrams in which it appears.
Diagrams
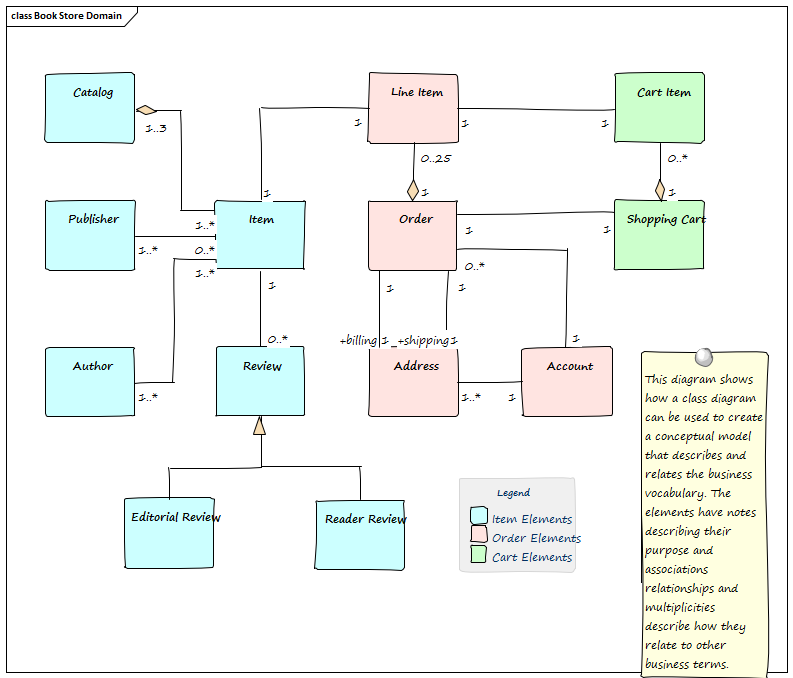
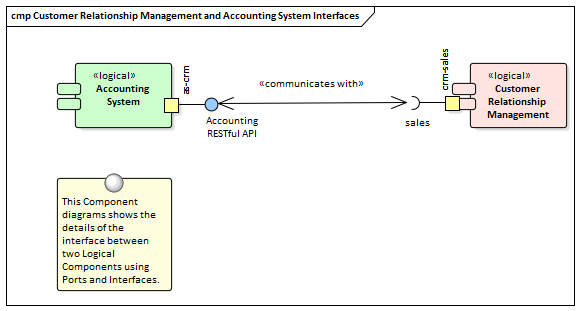
Diagrams are an expressive and visually compelling way of presenting information and can be carefully constructed to deliver a particular message. Diagrams can be used to communicate with stakeholders to provide a view of the architecture from a particular viewpoint. The same elements can appear in multiple diagrams and color, styles, filters, layout, alternative images and more can be used to convey meaning and create compelling diagrams that will help stakeholders engage with the architecture. The diagrams can be converted to a hand drawn style and a white board mode to create further appeal and to soften the edges of the formal modeling languages that can deter some stakeholders.
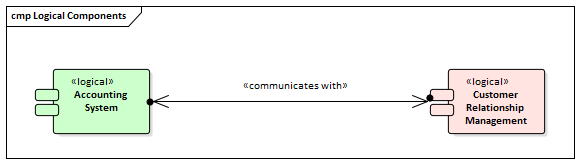
The same diagram can be altered to show the detail of the interface that has been rolled-up in the diagram above. This is a powerful facility that allows repository content to be automatically altered to create alternative views for different stakeholders.
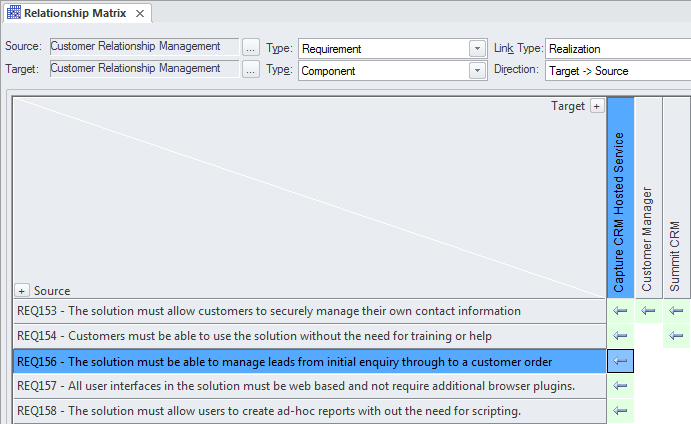
Matrices
The Relationship Matrix and Gap Matrix are grids that allow the relationships between two sets of element to be visualized in a matrix format with one set of elements on the horizontal axis and the other on the vertical axis. Markers at the intersection of a column and a row indicate information about the relationship between the two elements.